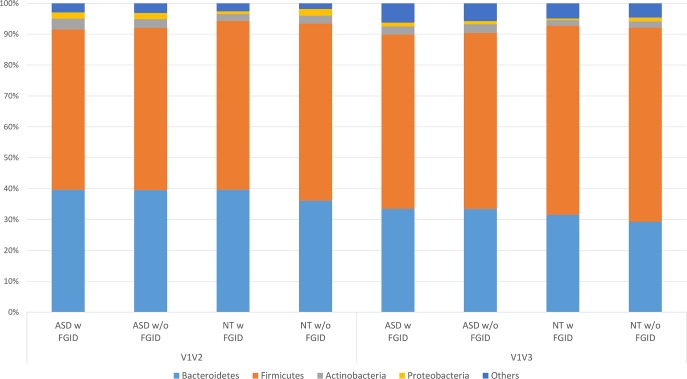
Fig 1. Phyla comparison between ASD children with FGID, ASD children without FGID, NT siblings with FGID and NT siblings without FGID, using Illumina V1-V2 and V1-V3 datasets.
The average relative abundance of each phyla (relative abundance ≥ 0.02) is shown for ASD w FGID, ASD w/o FGID, NT w FGID and NT w/o FGID for each of the two sequencing datasets (See S1 and S2 Tables for means ± standard deviations).

