
Fig 3. Sex-dependent WHRadjBMI loci.
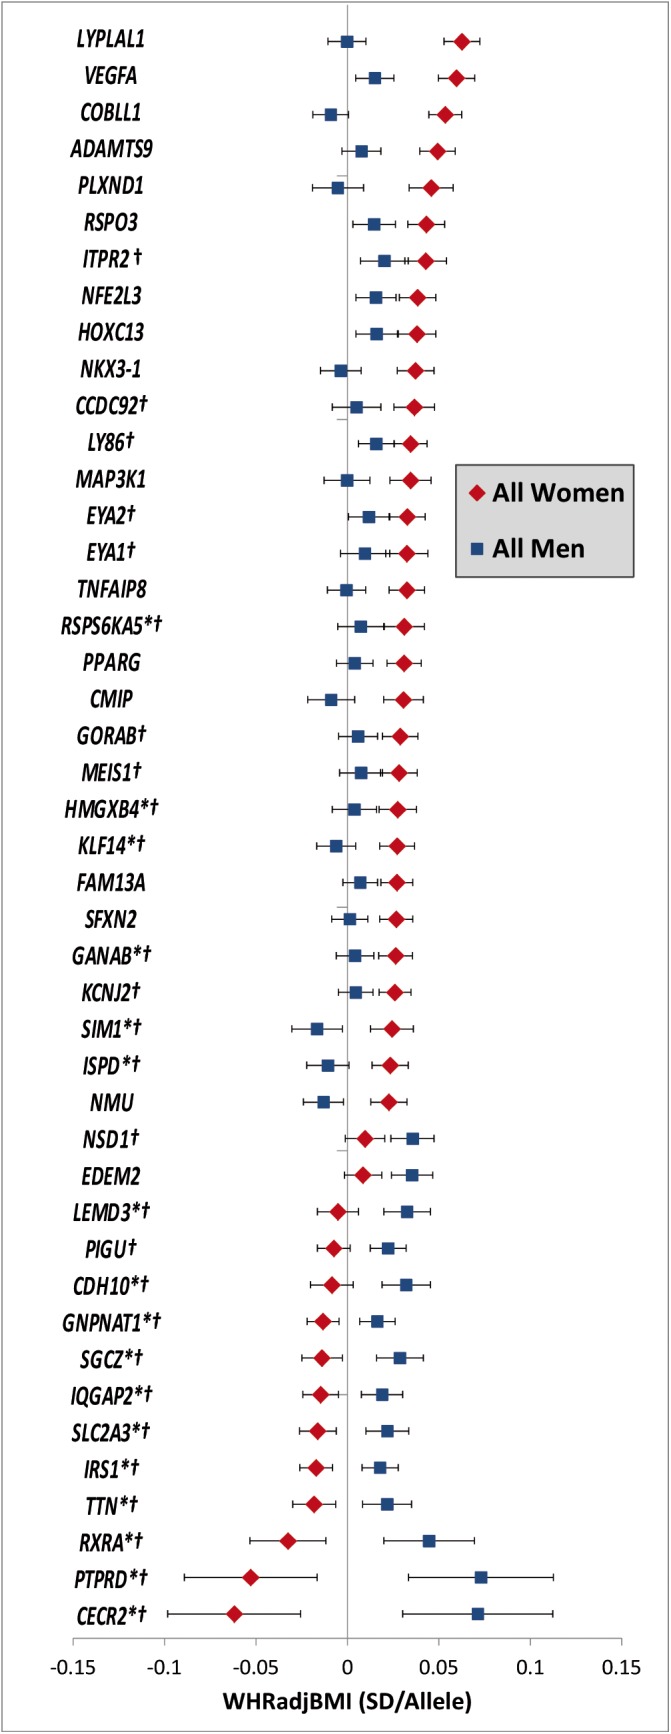
Effect estimates (beta ± 95CI) per standard deviation in WHRadjBMI and risk allele for loci showing sex-differences in women compared to men. Loci are ordered by greater magnitude of effect in women compared to men. (95%CI: 95% confidence interval; SD: standard deviation. *Newly identified loci. † Newly identified sex-differences)