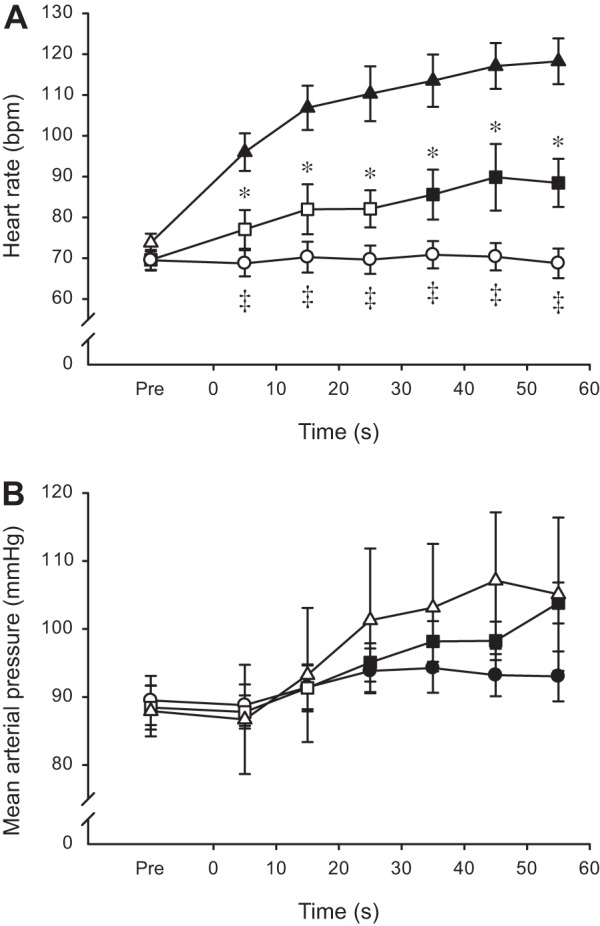
Fig. 2.

Heart rate (A) and mean arterial pressure (B) during sustained isometric contractions at different levels of maximal torque. Values are expressed as means ± SE. Contractions were performed at 30 (○), 60 (□), and 100% (△) of MVC torque. Solid symbols indicate data points that are significantly different from Pre (P < 0.05). Asterisks (*) denote time points when 60% MVC differs significantly from 100% MVC (P < 0.05). Double daggers (‡) denote time points when 30% is significantly different from both 60 and 100% MVC (P < 0.05).
