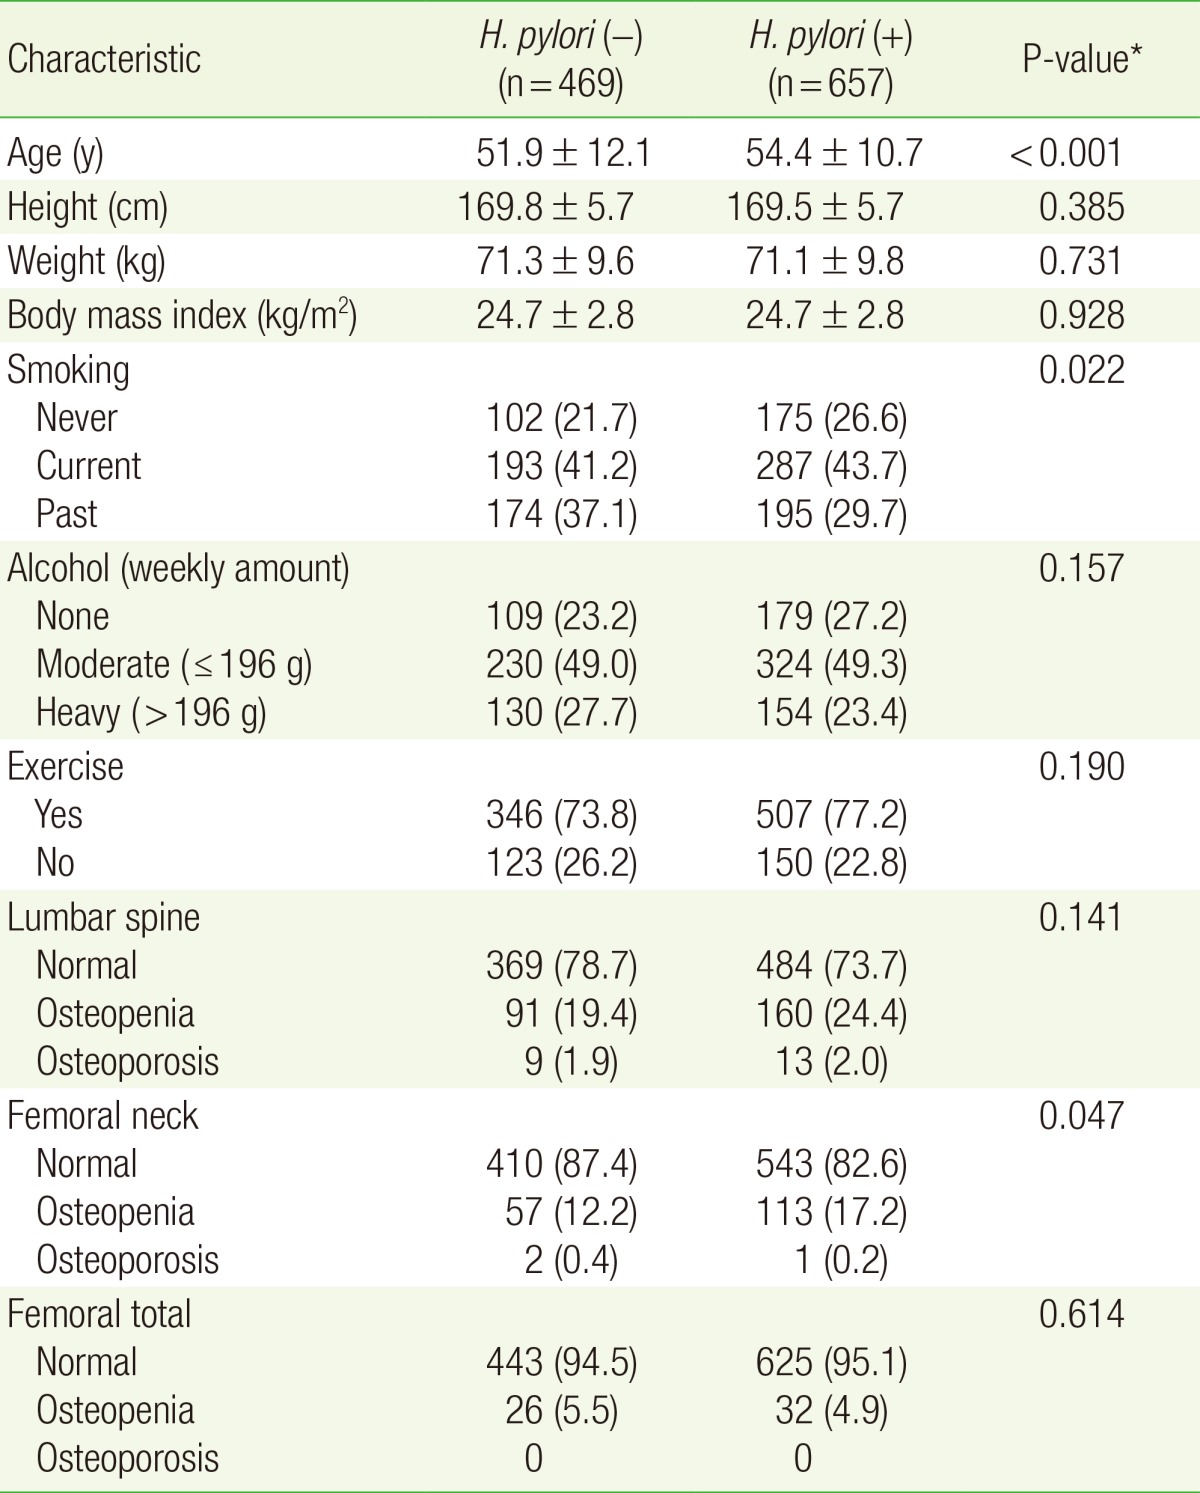
Table 1. Patient characteristics according to H. pylori infection status (N=1,126).

Values are presented as mean±standard deviation or number (%).
H. pylori, Helicobacter pylori.
*From t-test (for continuous variables) or chi-square test (for categorical variables).
