
Table 2. Baseline macronutrient intake according to quintiles of energy-adjusted dietary fat intake (g/d) (n=1,662).
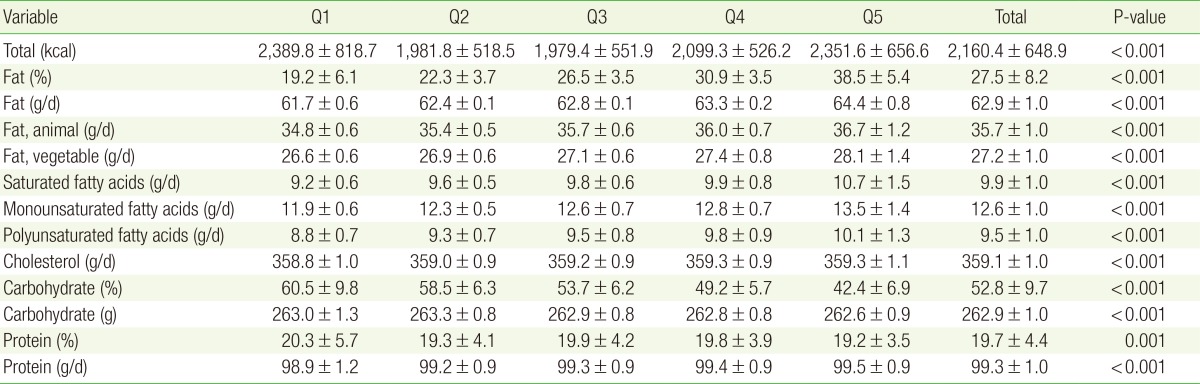
Values are presented as mean±standard deviation. All nutrient intakes are energy-adjusted by residual method. P-values are calculated from analysis of variance. Q1, 59.1-62.2 g/d; Q2, 62.2-62.6 g/d; Q3, 62.6-63.1 g/d; Q4, 63.1-63.6 g/d; Q5, 63.6-69.8 g/d.