
Table 4. Risk of metabolic syndrome components in the highest intake group as compared with the lowest intake group.
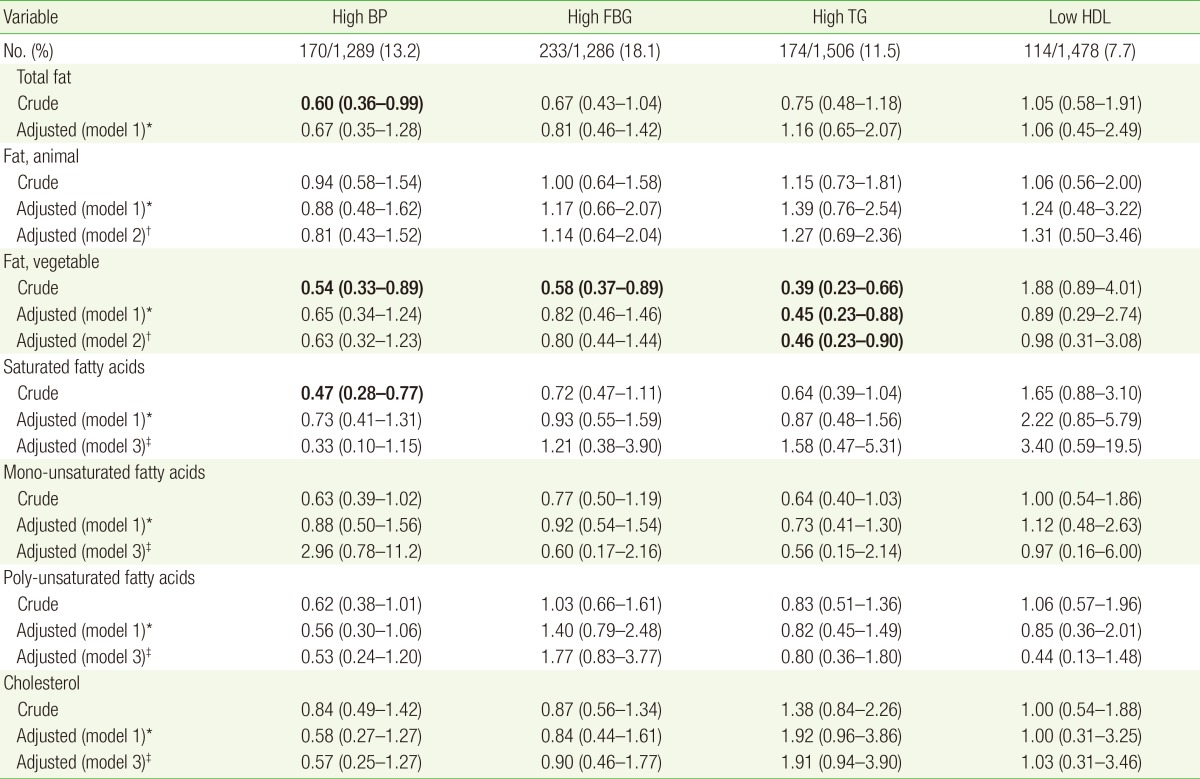
High BP ≥130/85 mm Hg, high FBG ≥100 mg/dL, high TG ≥150 mg/dL, low HDL: male <40 mg/dL, female <50 mg/dL. All nutrient intakes are energy-adjusted by residual method. P-value were calculated by multiple logistic regression analysis. Values in bold are P<0.05.
BP, blood pressure; FBG, fasting blood glucose; TG, triglyceride; HDL, high density lipoprotein cholesterol.
*Model 1: adjusted for age, sex, body mass index, smoking, alcohol, physical activity, baseline value of each metabolic syndrome component, protein intake, total calorie intake. †Model 2 included variables listed in model 1, animal fat and vegetable fat. ‡Model 3 included variables listed in model 1, saturated fat, mono-unsaturated fat, poly-unsaturated fat, and cholesterol (quintiles).