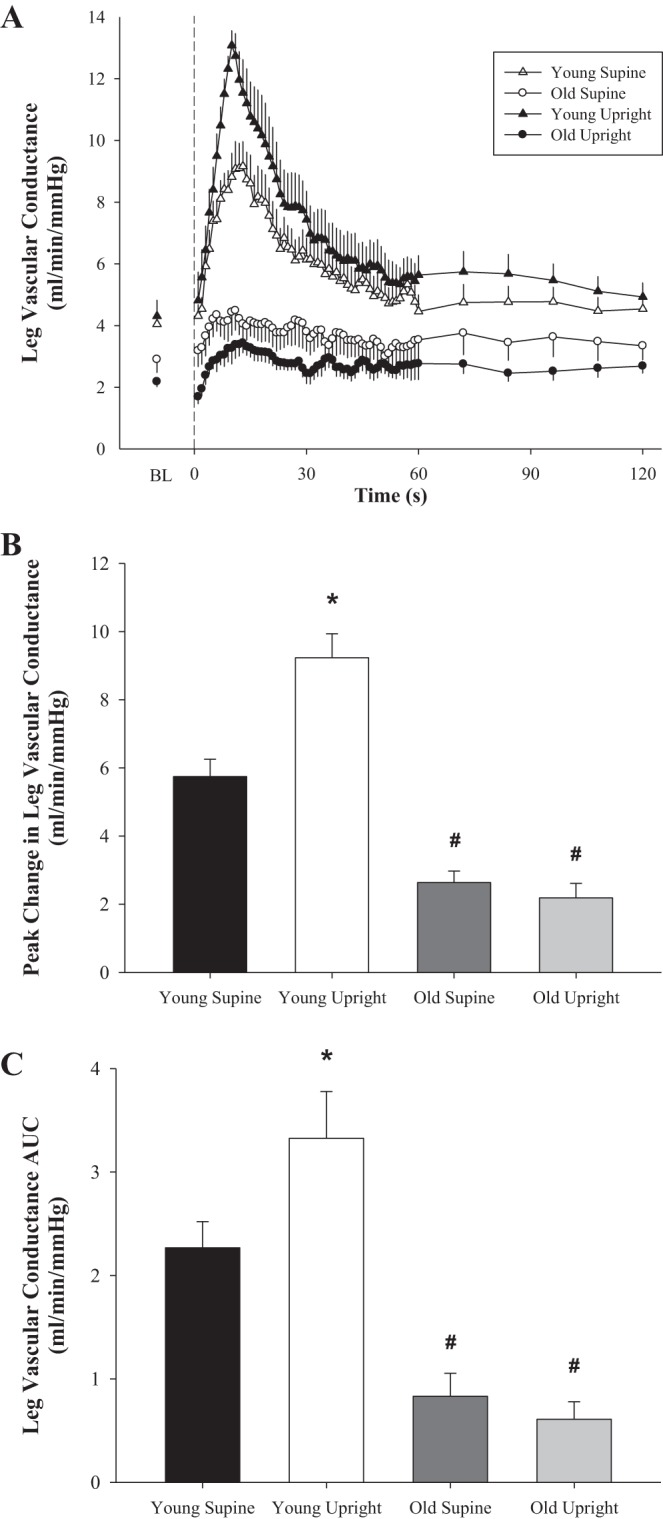
Fig. 2.

PLM-induced changes in leg vascular conductance (LVC) with age in women. A: second-by-second tracing of LVC (ml·min−1·mmHg−1) at baseline and throughout 2 min of PLM. B: peak change in LVC from BL (ΔLVCpeak, ml·min−1·mmHg−1). C: LVC AUC for the first 60 s of PLM (LVCAUC, ml·min−1·mmHg−1). Young, n = 10; old, n = 10. BL indicates the average of the 60 s just before initiation of PLM. Dashed line at 0 s indicates the start of 2 min of PLM. *P < 0.05, significantly different from supine posture; #P < 0.05, significantly different from young women. Values are means ± SE.
