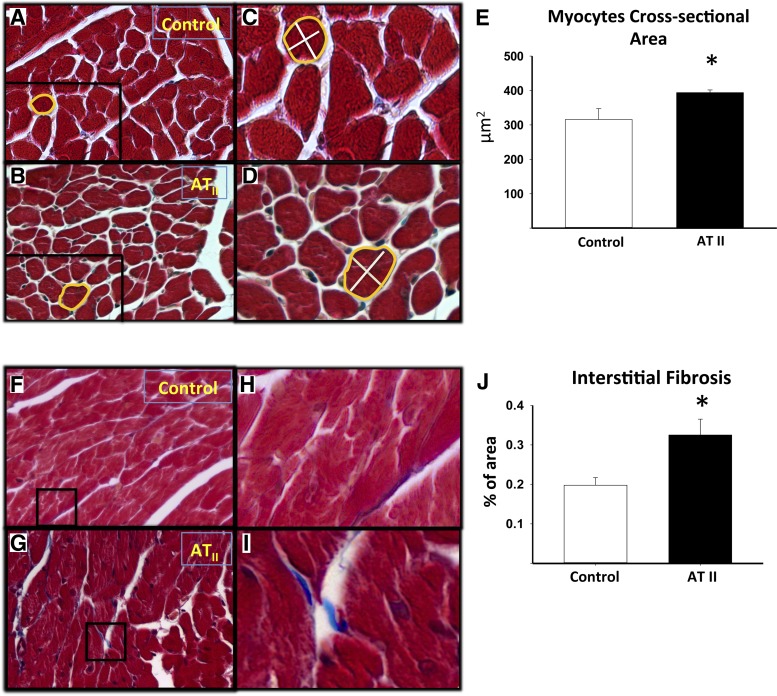
Fig. 5.
Measurement of cardiomyocyte hypertrophy and quantification of the interstitial fibrosis. A and B: Masson's Trichrome stain on heart sections were used to visualize the cross-sectional areas of cardiomyocytes (×20 magnification) of mice infused with control vehicle or ATII, respectively. C and D: areas of magnification of A and B, respectively. E: quantification of the cardiomyocyte cross-sectional areas of the control vehicle and ATII infused mice. F and G: representative pictures of Masson's Trichrome staining to quantify the fibrosis in tissue sections of hearts of mice infused with control vehicle or ATII, respectively (×20 magnification). H and I: areas of magnification of F and G, respectively. J: quantification of the interstitial fibrosis reported as percentage (%) of the area of fibrotic tissue on the total area. Values are group means ± SE; N = 8 animals/group. *P < 0.05.

