Figure 1.
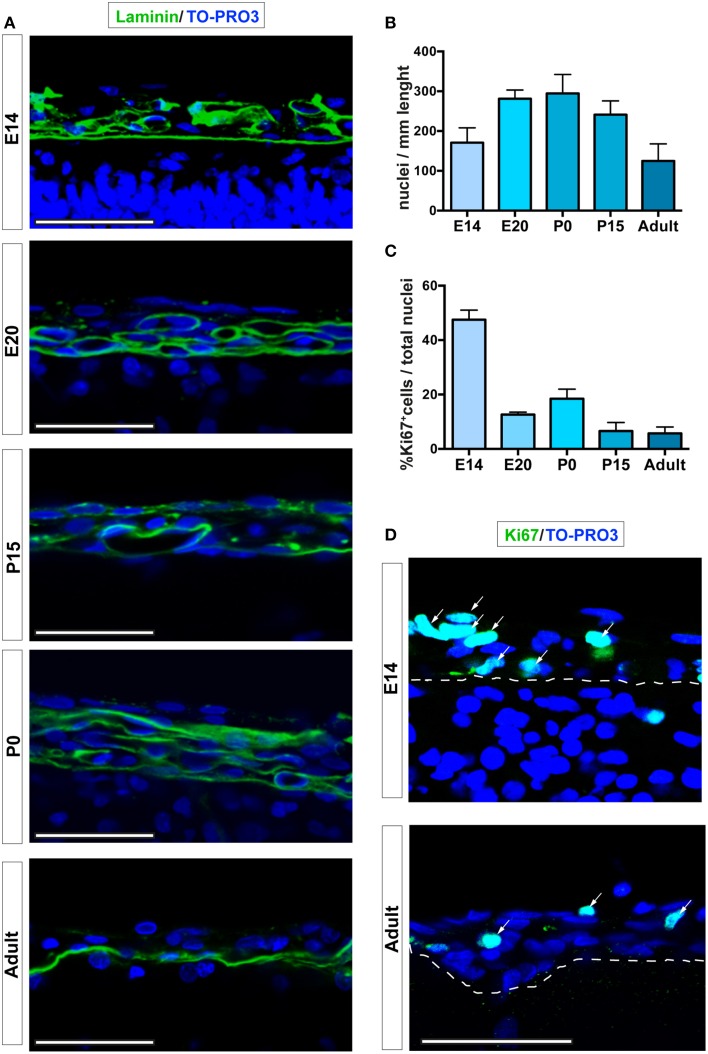
Leptomeningeal cells at different developmental stages. (A) Confocal microscopy analysis of leptomeninges at different stages of development; from top to bottom: E14, E20, P0, P15, adult. Basal lamina of the pia mater was visualized by laminin immunoreactivity (green). (B) Quantification of number of meningeal cell nuclei present along 1 mm of brain sections; number of nuclei peaked at P0. (C) Percentage of meningeal cells positive for the proliferation marker Ki67. The number of Ki67+ cells is maximum at E14 and decreases going to adulthood. The number of rats analyzed in (B,C) was n = 3 at E14, n = 6 at E20, n = 3 at P0, n = 5 at P15, and n = 4 at adulthood; values represent mean ± SD (D). Confocal microscopy representative images of Ki67+ cells (green) of E14 and 6–8 weeks adult rat brain leptomeninges. Arrows indicate Ki67+ cells, the white dashed line highlights the border between neural parenchyma and meninges. Nuclei are stained with TO-PRO3 (blue). Scale bar: 50 μm.

