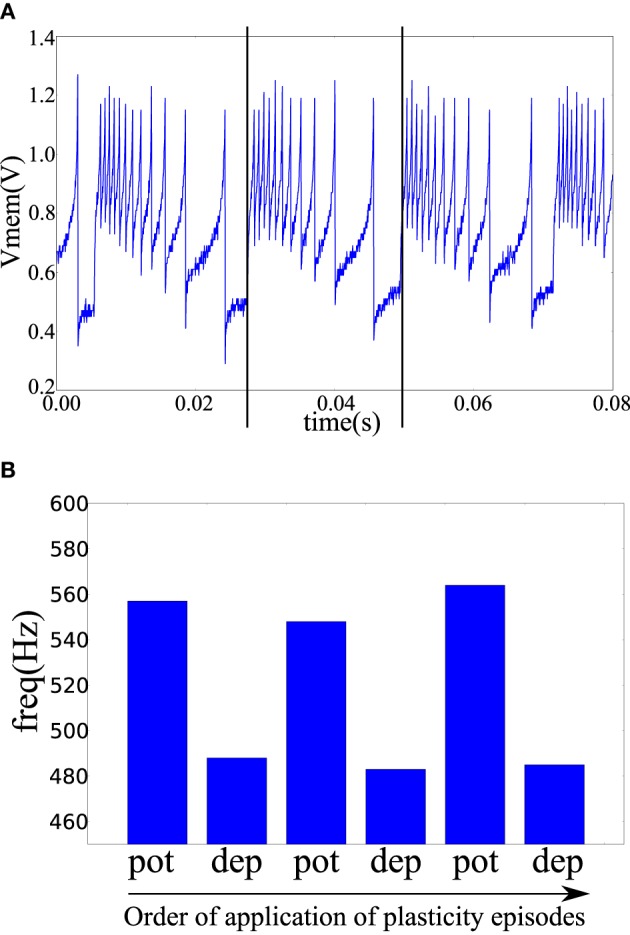
Figure 7.

(A) The post-synaptic membrane potential in response to a pre-synaptic pulse train of 47 Hz. Vertical lines indicate the times of two pre-synaptic spikes. (B) Frequency of the post-synaptic neuron after a number of plasticity episodes. Plasticity episodes were applied in succession by adjusting the analog biases to put the post-synaptic neuron tile in the potentiation and depression regimes.
