
Figure 1.
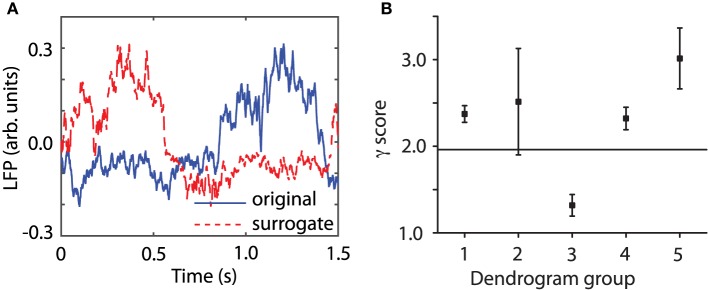
Surrogate data. An ensemble of 100 surrogate data sets similar to the original time series, but consistent with the null hypothesis, were generated using Tisean. (A) The original data from a randomly selected trial (blue continuous line) and one of its 100 surrogates (dashed red line) look similar. For each trial, 100 surrogates have been created by a stationary Gaussian linear process using the function surrogate of Tisean. (B) The discriminating statistic for the original trials and for each of their surrogates over all five groups showed that only the third group does not meet the nonlinearity criterion (the horizontal continuous line) since its γ score is less than 1.96. For all the other four groups the null hypothesis can be rejected.