
Figure 6.
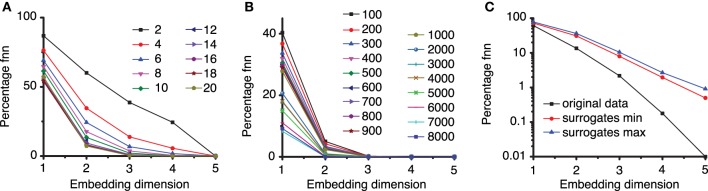
Percentage of false nearest neighbors. (A) For a too small ratio f < 7 of distances between neighbor points in different embedding dimensions, the percentage of false nearest neighbors is high and only drops near zero for very large embedding dimensions. For larger ration f > 7 all percentages drop to almost zero false nearest neighbors for an embedding dimension of dE = 3. This suggests that an optimum ratio is above f = 7, in agreement with results from others (Abarbanel, 1996; Konstantinou, 2002). (B) To avoid spurious spatial correlations due to inherent temporal correlation between too closely spaced points in a time series, the percentage of FNN was estimated with variable Theiler window (t). (C) The percentage of FNN is also a good discriminating statistics. For the third group of data from the first animal, the logarithmic plot shows that the percentage of FNN for the original data (solid squares) is always smaller than any of the 100 surrogates. Only the envelopes of the minimum (solid circles), respectively, maximum (solid triangles) values of FNN are shown.