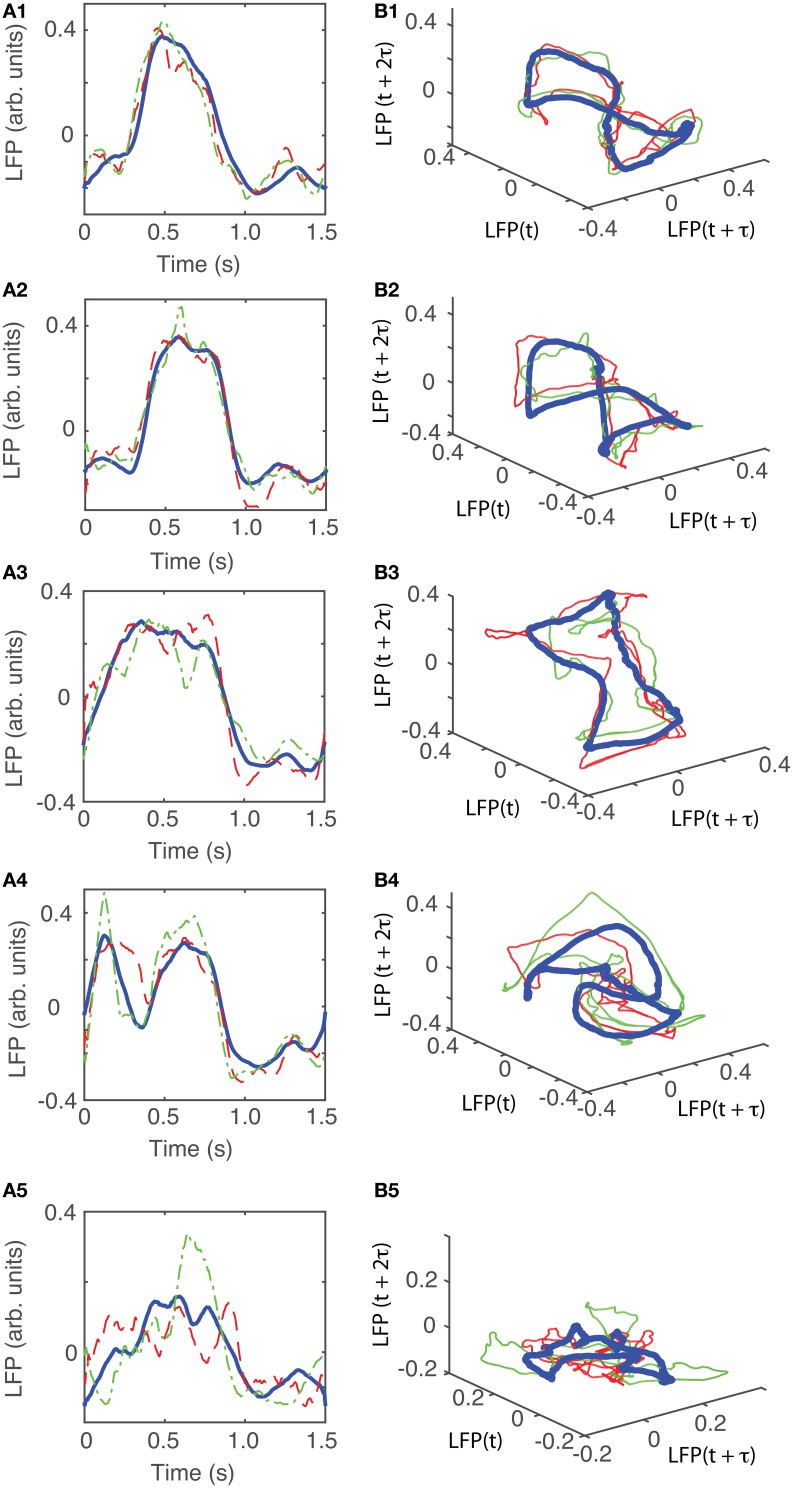
Figure 9.
Reconstructed 3-dimensional attractor for animal #2. (A1–A5) Show the average LFP for each of the five main groups of the corresponding dendrogram (blue thick line) and two randomly selected trials form the same group (red dashed and green dashed-dotted line). (B1–B5) Show the corresponding three dimensional reconstructed attractors. With the exception of the last group of LFP recordings, the attractors look similar after they are appropriately rotated and/or phase shifted.

