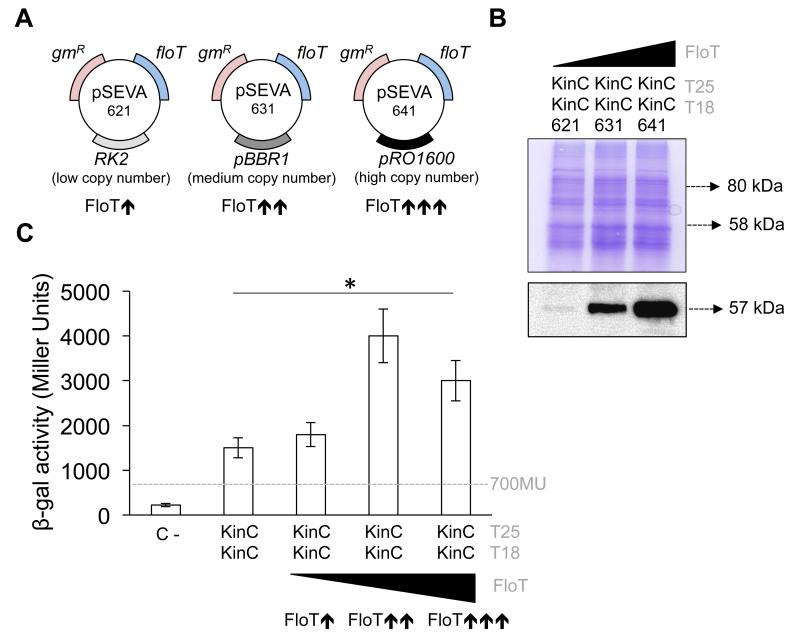
Figure 5. The presence of FloT favors the self-interaction of KinC.
(a) Schematic representation of the three different pSEVA plasmids that were used to express FloT at different concentration levels. pSEVA 621, 631 and 641 maintain similar backbones and contain a gene that provides resistance to gentamicin (gmR) and the construct FloT-His6 The plasmids carry a different replication origin. pSEVA 621 carries the low-copy number replication origin RK2. pSEVA 631 carries the medium-copy number replication origin pBR1. pSEVA 641 carries the high-copy number replication origin pRO1600. The strains that carry each of these plasmids produce FloT at different concentration levels, in direct function of the number of floT genes that are expressed in the strain. (b) Immunoblot analysis showing the distinct concentrations of FloT that were produced in B3H cells when carrying lower- (pSEVA-621), medium- (pSEVA-631) and high-copy (pSEVA-641) plasmids expressing His6-tagged FloT. Strains produced lower ( ), medium (
 ) and higher (
 ) concentration of FloT in the B3H assay, respectively. SDS-PAGE is shown as the loading control. (c) B3H assay to quantify the interaction of KinC under different concentrations of FloT. Dashed line indicates the threshold limit that defines a positive (≥ 700 Miller Units) or a negative interaction signal (≤ 700 Miller Units) according to the instructions of the manufacturer. Results represent a mean of three independent experiments (* Student’s t-test, p ≤ 0.05).

