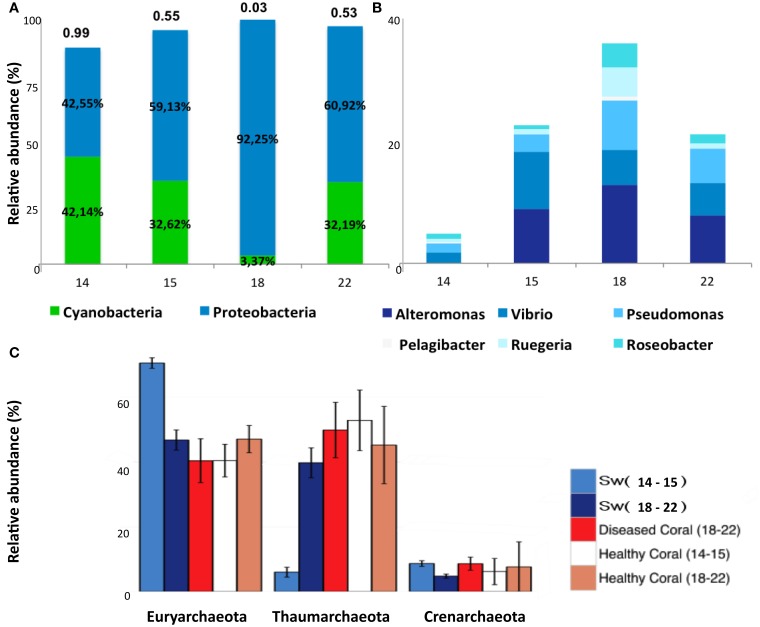
Figure 2.
Relative abundances of Cyanobacteria, Proteobacteria, and Archaea. (A) Cyanobacteria and Proteobacteria relative abundances in samples Sw14, -15, -18, and -22. The ratio C:P is shown above bars. (B) Relative abundances of GammaProteobacteria (Alteromonas, Vibrio, Pseudomonas) and AlphaProteobacteria (Candidatus pelagibacter, Ruegeria, and Roseobacter) in samples Sw14, -15, -18, and -22. (C) Relative abundances of Euryarchaeota, Thaumarchaeota and Crenarchaeota in pooled samples seawater Sw14–15, Sw18–22; and M. decactis healthy indicated as Healthy coral (14–15) and (18–22); and diseased indicated as Diseased Coral (18–22).

