
Fig. 2.
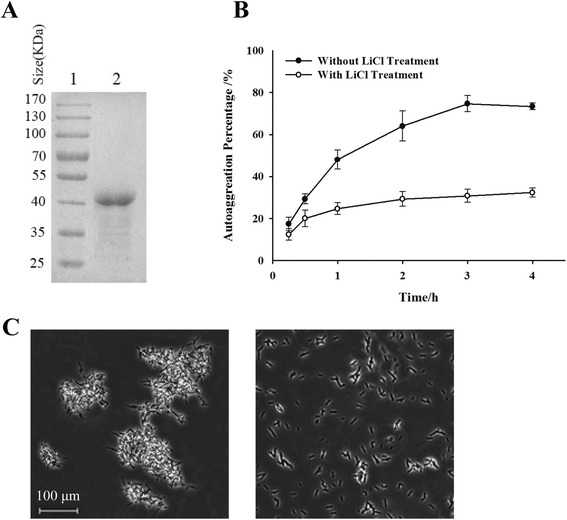
Influence of S-layer protein on the cell surface properties of L. helveticus NS8. a. SDS-PAGE profile with Coomassie blue staining of extracted S-layer protein by LiCl treatment, indicating an approximate mass value of 42 kDa. Lane 1, low molecular weight protein standards; lane 2, 5 μg of purified protein was loaded on the gel. b. Comparison of the autoaggregation ability of NS8 before (●) and after removal of their surface layer proteins (○). Error bars represent standard deviations (SD) of the mean values of results from three replicate experiments. c. Bacterial micrographs of NS8, showing the morphology difference between autoaggregated cells (left) and those cells after removal of S-layer proteins (right). Magnification, × 100