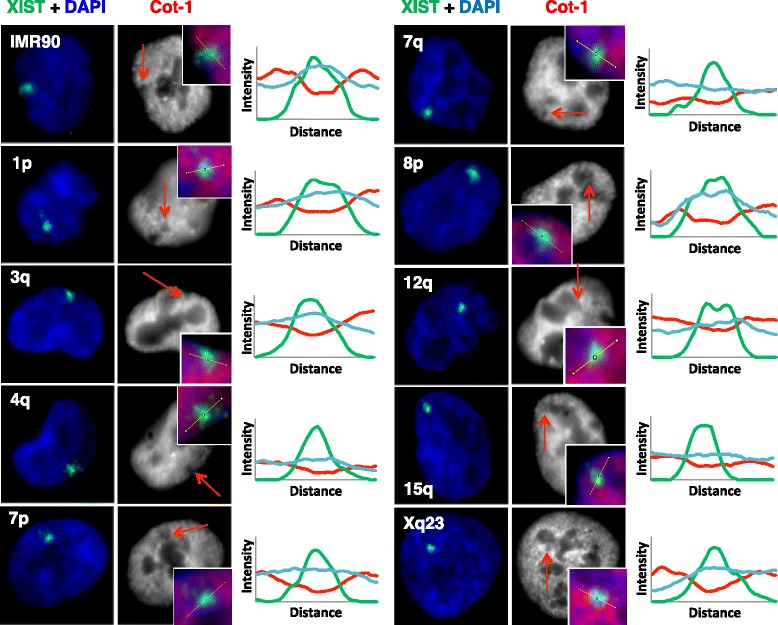
Fig. 1.

XIST RNA localizes and forms Cot-1 holes when expressed from nine different integration sites. Shown is XIST RNA FISH (green) upon expression of an inducible XIST transgene integrated into the indicated chromosomal locations in HT1080 cells. IMR90 cells (a female fibroblast line) are shown as a positive comparator. Cells were counter-stained with DAPI (blue) and co-hybridized with Cot-1 (labelled with spectrum-red, but shown in grayscale). Arrow indicates the location of the XIST signal and reduction in Cot-1 staining. Graphs to the right show the RGB intensities across the lines shown in the picture inserts drawn through the XIST clouds (XIST (green), Cot-1 (red), and DAPI (blue))
