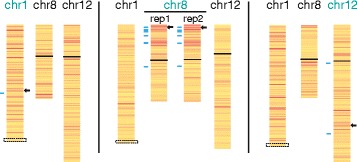
Fig. 4.

Silencing of endogenous genes upon ectopic XIST expression. Allelic inactivation of chromosomes 1, 8, and 12 is shown as a heat map following DOX induction of XIST in cells containing integrations into the chromosome listed in green. Colors denote the allelic expression change as assessed by RNA-seq (red = downregulation; yellow = no change) for those genes with allelic reads with FPKM ≥5. The integration site is marked as a black arrow; confirmatory pyrosequencing assays are indicated by blue lines, and the centromere is shown as a black line. For chromosome 1, the chromosome is truncated at the site of a translocation as it is unknown whether the integration is on the translocated chromosome (boxed region)
