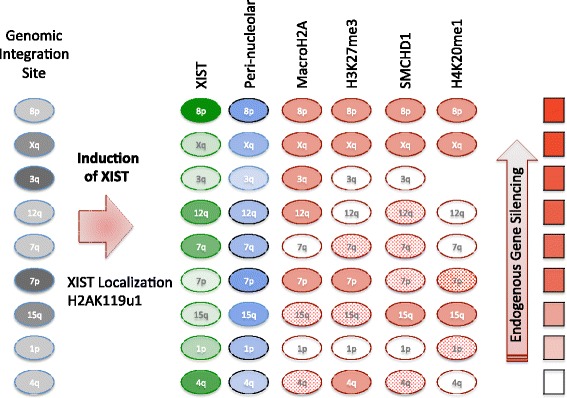
Fig. 7.

Schematic of features examined at the site of XIST RNA induction. Nine different integration sites of XIST were examined, and these were in both G-light (pale gray) and G-dark genomic locations. Upon DOX induction XIST was expressed (intensity of green oval reflects average amount of XIST expression) and increased perinucleolar localization was observed (blue oval intensity reflects increase, with significant changes encircled in black). H2AK119u1 was enriched at all four integration sites examined. The enrichment of chromatin marks or proteins that were variably recruited (see Table 2) is shown as solid (enrichment >25 %), dotted (enrichment between 10 % and 25 %) or unfilled (enrichment ≤10 %). The integration sites are ordered by ranking of gene silencing observed by pyrosequencing (fill of red rectangle reflecting proportion of silenced genes, see Additional file 3)
