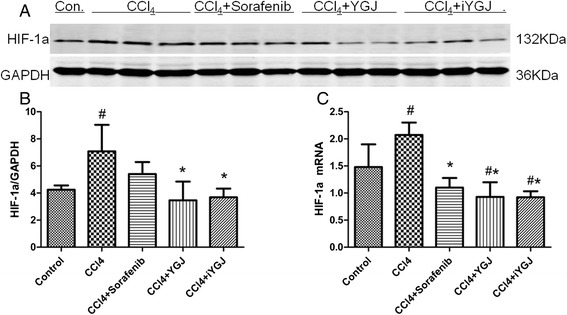
Fig. 5.

Effects of YGJ and iYGJ on HIF-1α. a Western blot quantified protein expression of HIF-1α. GAPDH expression was a control for equal protein loading. b Quantification of band intensities of expressed proteins. n = 3. c HIF-1α mRNA expression was measured by RT-PCR. n = 3. Quantitative data were reported as means ± SD, #, compared to control group P < 0.05; *, compared to CCl4 model group P < 0.05
