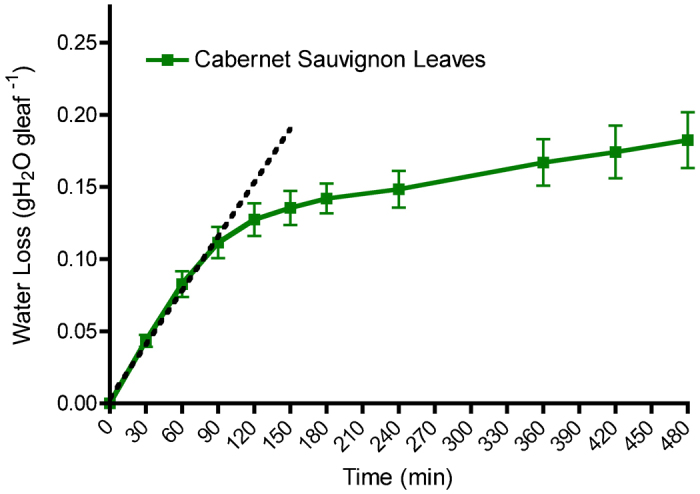
Figure 1.

Water loss of Cabernet Sauvignon leaves over an 8-h period. Intermediate leaves were selected based on their position from the shoot tip (fifth to sixth leaf). Water loss for the first hour and a half follows a linear trend followed by a decrease in the amount of water lost. Each data point is presented as the mean±s.e.m. (n=4). The dotted line was fitted to the first three time points by linear regression.
