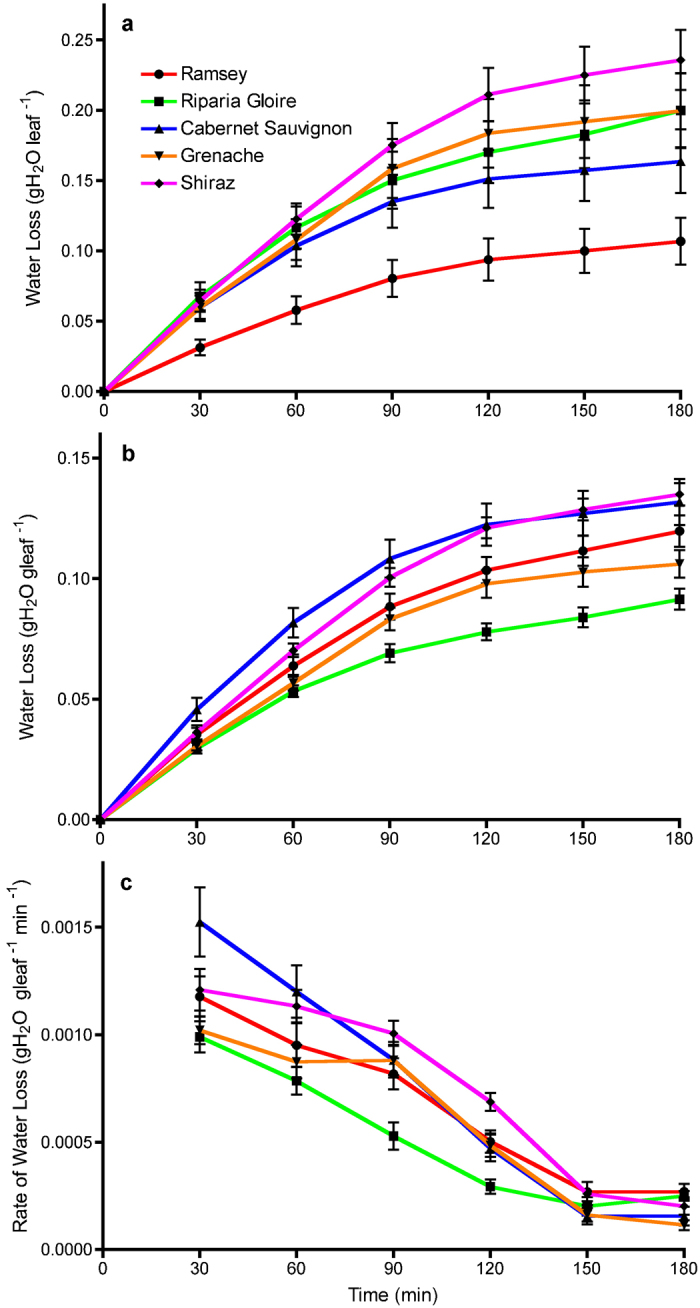
Figure 5.

(a) Water loss in the dehydration assay expressed on a per leaf basis. Each data point is presented as the mean±s.e.m. (n=18 for Ramsey, Grenache and Shiraz; n=19 for Riparia Gloire and Cabernet Sauvignon). (b) Water loss in the dehydration assay normalized on a leaf weight basis. Each data point is presented as the mean±s.e.m. (n=18 for Ramsey, Grenache and Shiraz; n=19 for Riparia Gloire and Cabernet Sauvignon). (c) Rate of water loss from each genotype in the dehydration assay. Each data point is presented as the mean±s.e.m. (n=14 for Ramsey; n=18 for Grenache and Shiraz; n=19 for Riparia Gloire and Cabernet Sauvignon).
