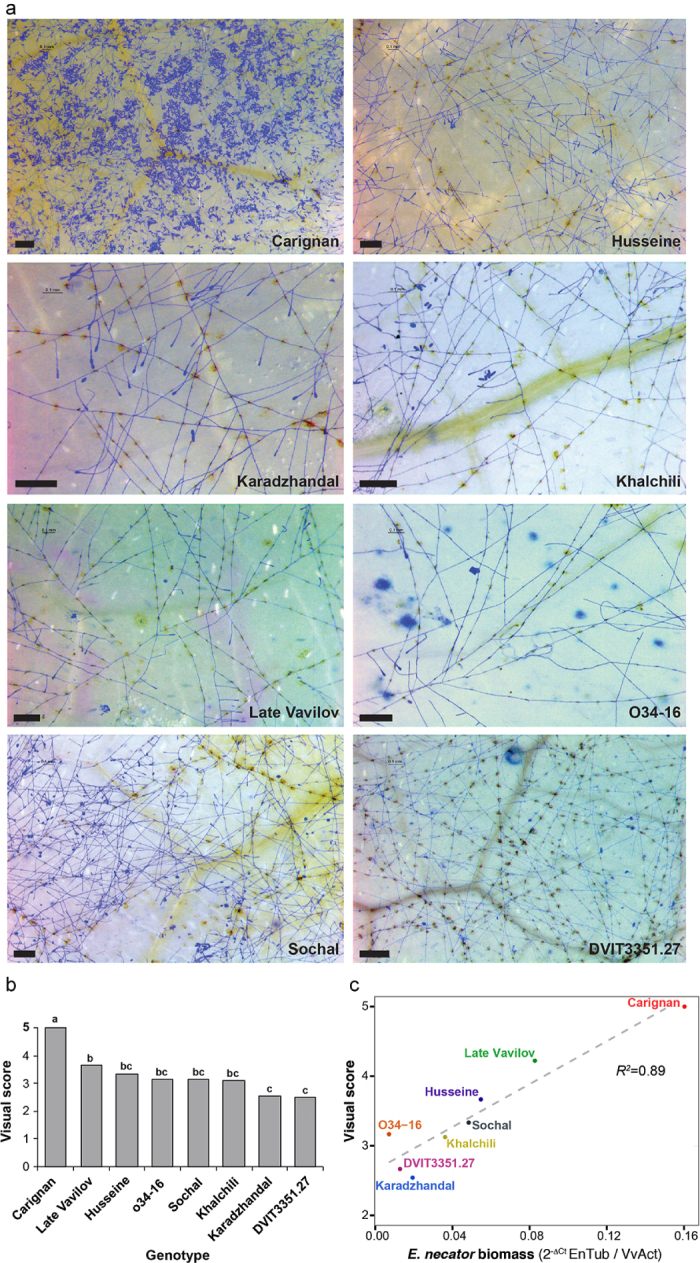
Figure 1.

Characterization of PM susceptibility in the eight V. vinifera cv (a) Micrographs of E. necator infection at 14 dpi. Bars = 0.2 mm (b) Mean visual scores of PM susceptibility in the eight cultivars. Different letters depict significant differences based on ANOVA followed by Tukey’s HSD test (P ≤ 0.05). (c) Correlation between visual scores of disease susceptibility and E. necator biomass measured by qPCR.
