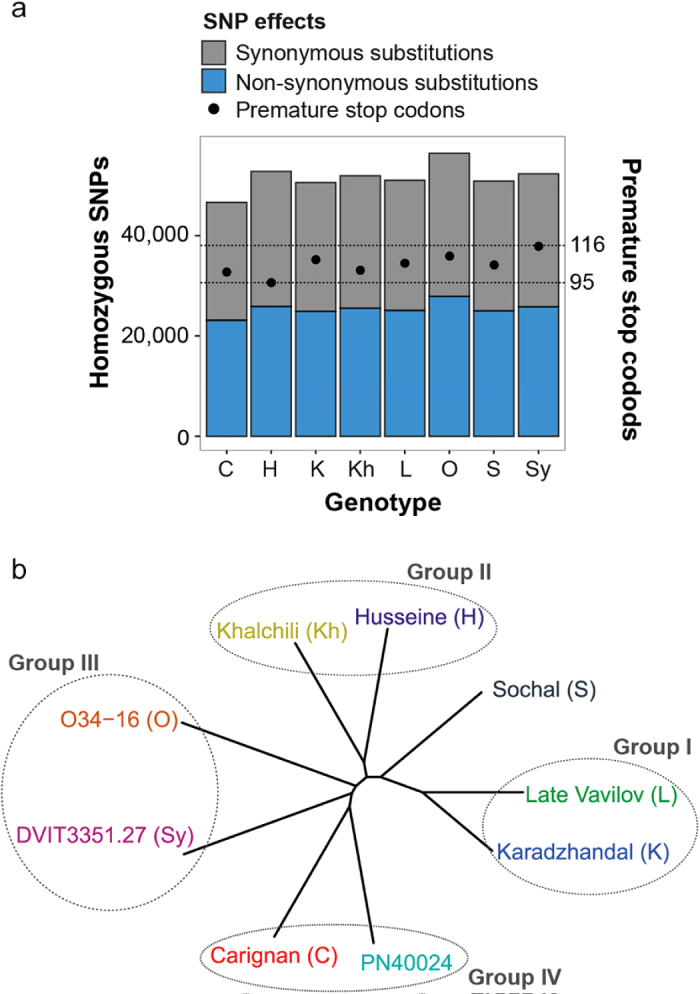
Figure 2.

Genetic diversity of the sequenced transcriptomes (a) Barplots showing the total number of homozygous SNPs resulting in synonymous or non-synonymous substitutions, or premature stop codons (b) Unrooted phylogenetic tree obtained from multiple alignment of synthetic transcripts reconstructed by incorporating the detected homozygous SNPs. Based on relatedness, genotypes were assigned to four groups.
