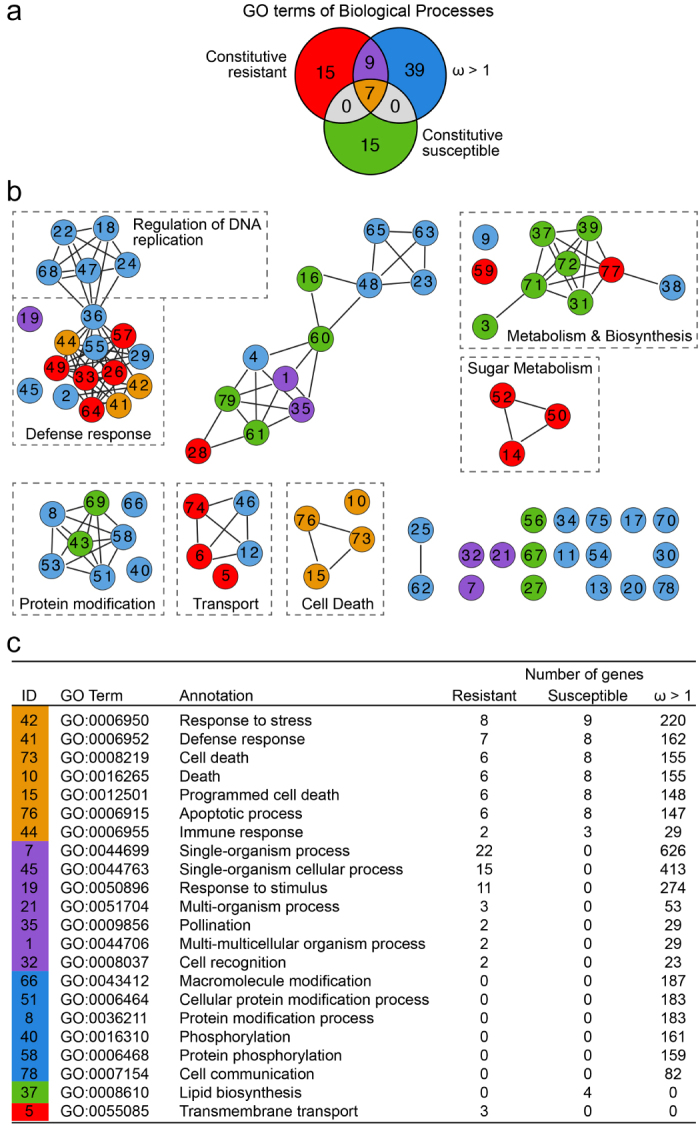
Figure 3.

GO term enrichment overlap between genes under positive selection (ω > 1), genes with higher constitutive expression in the Central Asian accessions, and genes with higher constitutive expression in ‘Carignan’ (a) Venn diagram showing numbers of overlapping and specific GO terms in each of the three groups of genes. (b) Graphical representation of relationships between enriched GO terms. To highlight closely related enriched GO terms, terms were organized in undirected sub-graphs using the REViGO web server.37 Colors indicate the gene group in which the GO terms are enriched, consistent with panel A. Dashed boxes indicate similar biological functions among the GO terms. Supplementary Dataset S3 provides all the GO terms and numeric IDs that are not described in panel C. (c) GO Categories with the greatest number of gene members are listed for each gene group, with the color coding of column 1 consistent with the gene groups shown in panel (a). Column 1 identifiers correspond to the circles in panel (b).
