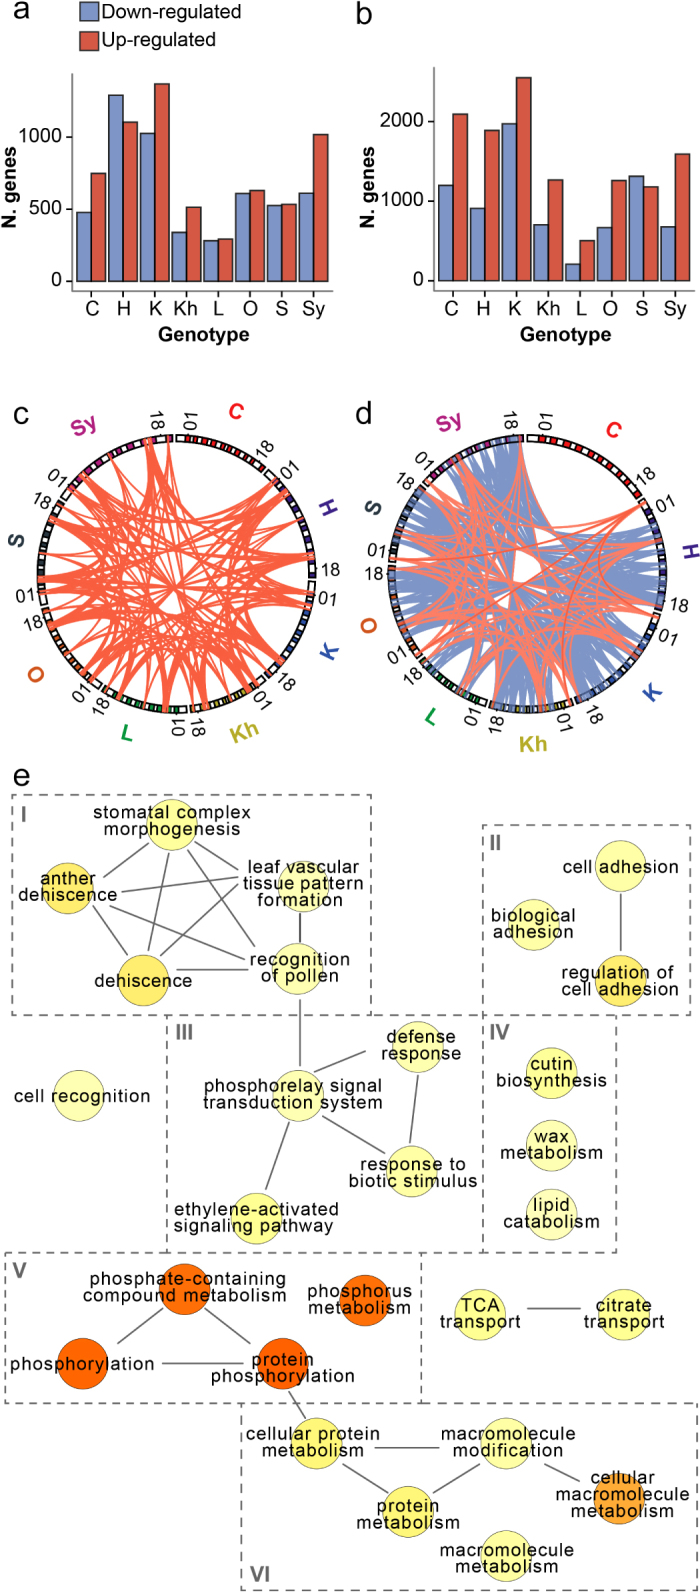
Figure 4.

Transcriptional responses to PM infection in the Central Asian accessions Barplots indicating the number of differentially regulated genes (P <0.05) at 1 (a) and 5 (b) dpi. Circos75 plots showing common differentially expressed genes between at least 6 resistant accessions at 1 (c) and 5 (d) dpi. Red and blue lines represent common up- and down-regulated genes, respectively. External bands correspond to each of the 19 chromosomes (+ Chr00) where the genes are located. A full list of genes represented by the connections in (c) and (d) are listed in Table 2. (e) Enriched GO terms (P <0.05) within the set of resistant-specific genes listed in Table 2. Darker colored circles represent terms with lower P values. Organization of sub-graphs is determined by REViGO web server.37 Boxes around terms group terms based on functional similarities, including (I) plant growth, (II) cell adhesion, (III) defense responses, (IV), cuticle formation, (V) phosphorylation, and (VI) cellular metabolism.
