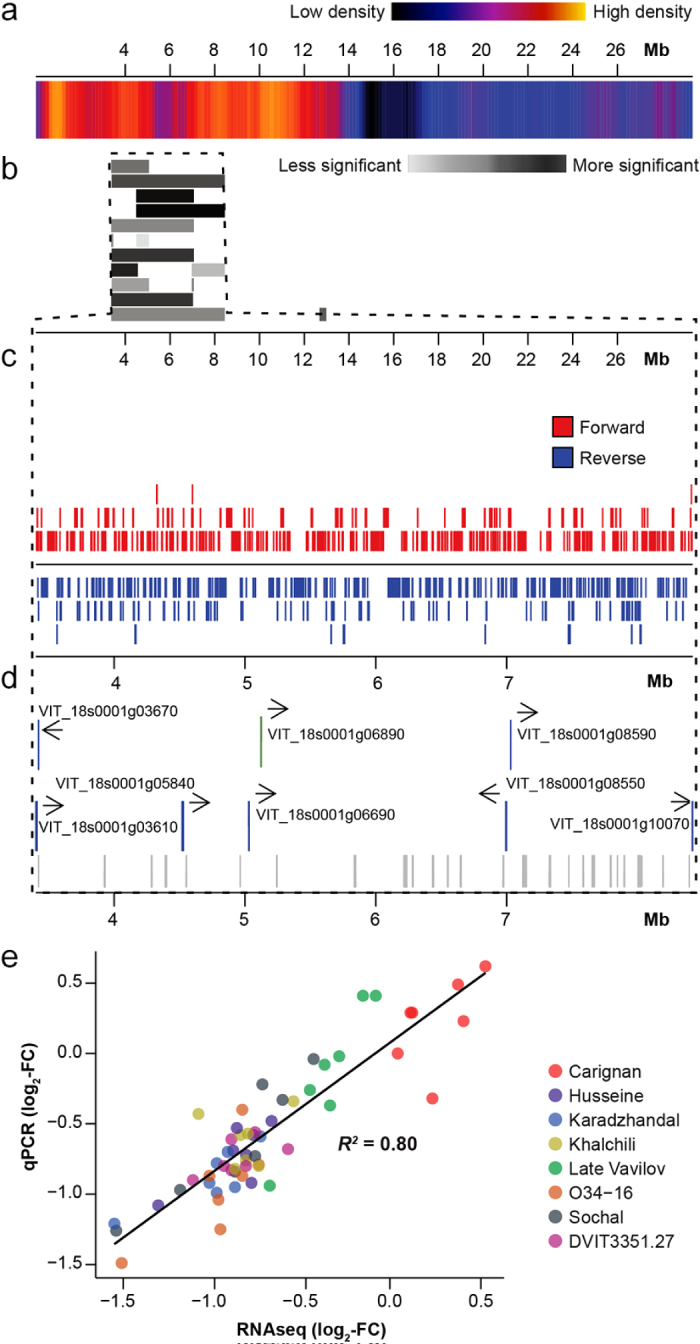
Figure 5.

Genomic region with significant enrichment in PM-responsive genes in the Central Asian accessions. (a) Heatmap showing gene density along chromosome 18. Colors range from dark blue (smaller gene density) to red (greater gene density). (b) Graphical representation of the PGE analysis results. Bars represent regions of chromosome 18 with significant enrichment in differentially expressed genes (P < 0.05). (c) Graphical representation of the location of protein-coding genes in the region identified by PGE analysis. Each box represents the exon of a protein-coding gene. (d) Locations of genes that are either detected as differentially expressed specifically in the Central Asian accessions in response to E. necator (blue) or constitutively more expressed in the Central Asian accessions than in ‘Carignan’. Gray boxes identify genes in the same regions that are under positive selection (ω > 1). (e) Correlation between PM-induced fold-changes measured by qRT-PCR and RNAseq.
