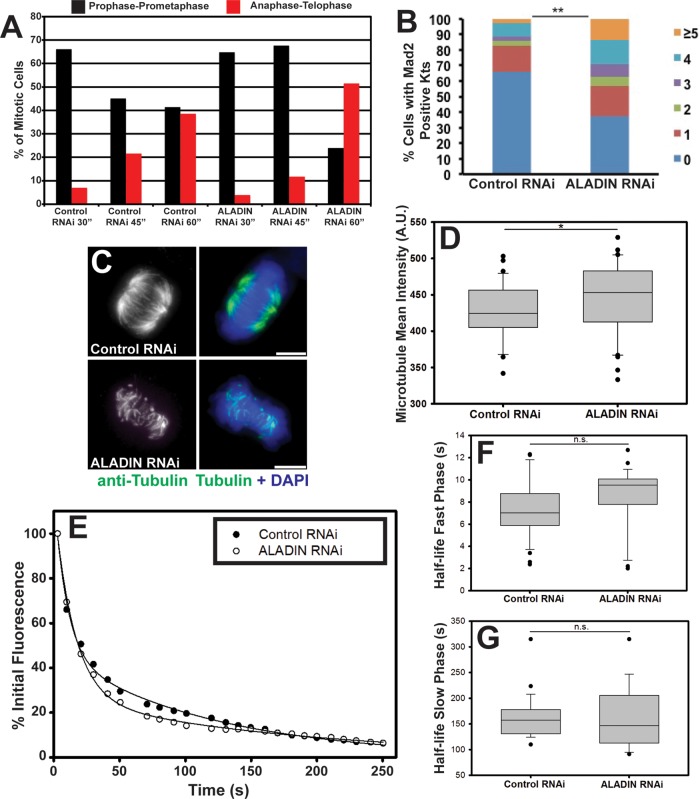
FIGURE 4:
ALADIN is required for timely chromosome alignment and k-fiber stability. (A) Control and ALADIN-depleted cells were fixed and stained to visualize microtubules and DNA at the indicated times after monastrol washout. Mitotic cells were divided into three subclasses based on spindle and DNA morphology: prophase-prometaphase, metaphase, and anaphase-telophase; the percentages of cells within each subclass are plotted at the indicated time points. (B) Control and ALADIN-depleted cells incubated with MG132 were fixed and stained for Mad2 and ACA; the percentages of cells from two independent experiments with one, two, three, four, or five or more Mad2-positive kinetochore pairs are shown (**p < 0.05). (C) Representative maximum intensity projections of cold-treated control and ALADIN-depleted cells fixed and stained with anti–α-tubulin (green) and DAPI (blue). Scale bars, 5 μm. (D) Quantification of the microtubule density of fixed anti-tubulin–stained cells treated with control or ALADIN siRNAs. At least 40 microtubule spindle intensities were measured from three independent replicates (*p < 0.1). (E) Representative fluorescence intensity of PA-GFP-tubulin after photoactivation of spots within spindles of HeLa cells treated with the indicated siRNAs. Lines show fitting of a double-exponential curve to the decay of fluorescence. Box-plot of the half-time of microtubule turnover measured for the fast (F) and slow (G) phases from at least 24 cells in each condition from three separate biological replicates. ALADIN depletion does not induce a significant increase in the flux of interpolar microtubules (fast phase, 7.395 vs. 8.502 s, p = 0.123) or k-fibers (slow phase, 161.02 vs. 160.21 s, p = 0.957).

