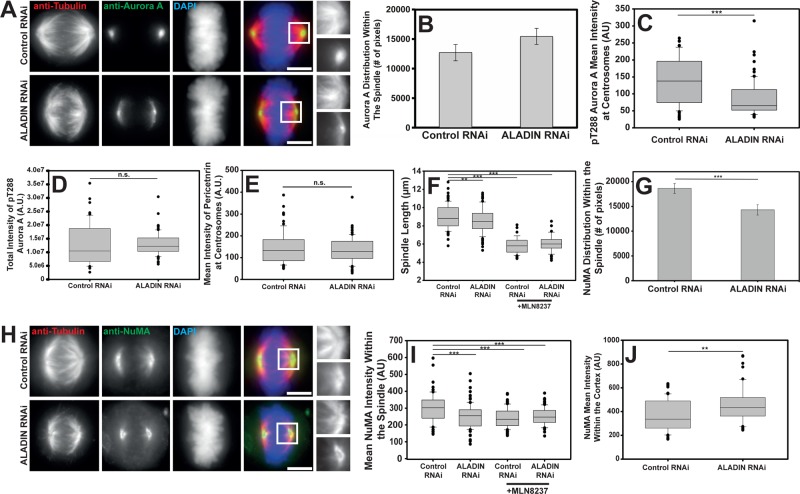
FIGURE 6:
ALADIN is necessary for the proper localization and activity of Aurora A and NuMA. (A) Representative maximum intensity projections of Aurora A (green), tubulin (red), and DAPI (blue) in control and ALADIN-depleted cells. Shown for comparison are magnified views of microtubules (top) and Aurora A (bottom) from within the boxed regions in the merged images. (B) Quantification of the number of Aurora A–positive pixels within the spindle (12,714 vs. 15,478; mean ± SEM; at least 36 cells from four independent experiments). (C) Mean Aurora A activity at spindle poles in cells treated with the indicated siRNAs was quantitated using the phospho-T288 specific antibody. Pericentrin labeling was used to mark the centrosome, and phospho-T288 intensity was measured only under the pericentrin mask. At least 39 cells were measured in each condition from two independent replicates. (D) The total intensity of phospho-T288 Aurora A within cells treated with control or ALADIN-specific siRNAs as measured in Z-stacks. At least 79 cells were measured for each condition. (E) Mean intensity of pericentrin in cells treated with the indicated siRNAs (145.29 vs. 134.71) was measured; at least 39 cells from two replicates were measured for each condition. (F) Cells treated with the indicated siRNAs were incubated with or without MLN8237 and then fixed and stained to visualize α-tubulin and chromosomes. Spindle length was measured for >46 spindles for each condition across three replicates. (G) Quantification of the number of NuMA-positive pixels within spindles of cells treated with the indicated siRNAs (mean ± SEM; at least 35 cells measured from four independent replicates). (H) Representative maximum intensity projection of control and ALADIN-depleted HeLa cells fixed and stained to visualize tubulin (red), NuMA (green), and DAPI (blue). Also shown are magnified views of microtubules (top) and NuMa (bottom) from within the boxed regions in the merged images. (I) ALADIN depletion reduces the average NuMA intensity within the spindle in a manner similar to Aurora A inhibition. Control or ALADIN-specific siRNA–treated cells were incubated or not for 40 min in MLN8237 and then fixed and stained to visualize NuMA and microtubules. Average NuMA intensity was measured within the spindle of at least 33 cells from four biological replicates (mean intensities 297.9, 253.2, 240.1, and 251.8). (J) Mean intensity of NuMA on the polar cortex was measured in control and ALADIN-depleted metaphase cells. At least 50 cells were measured for each condition. Box-and-whisker plots: box middle line shows the median and the bottom and top lines show the lower and upper quartiles (25 and 75%). Whiskers extend between the 10th and the 90th percentiles, and all outliers (dots) are shown. **p < 0.003, ***p < 0.0001, n.s. nonsignificant.

