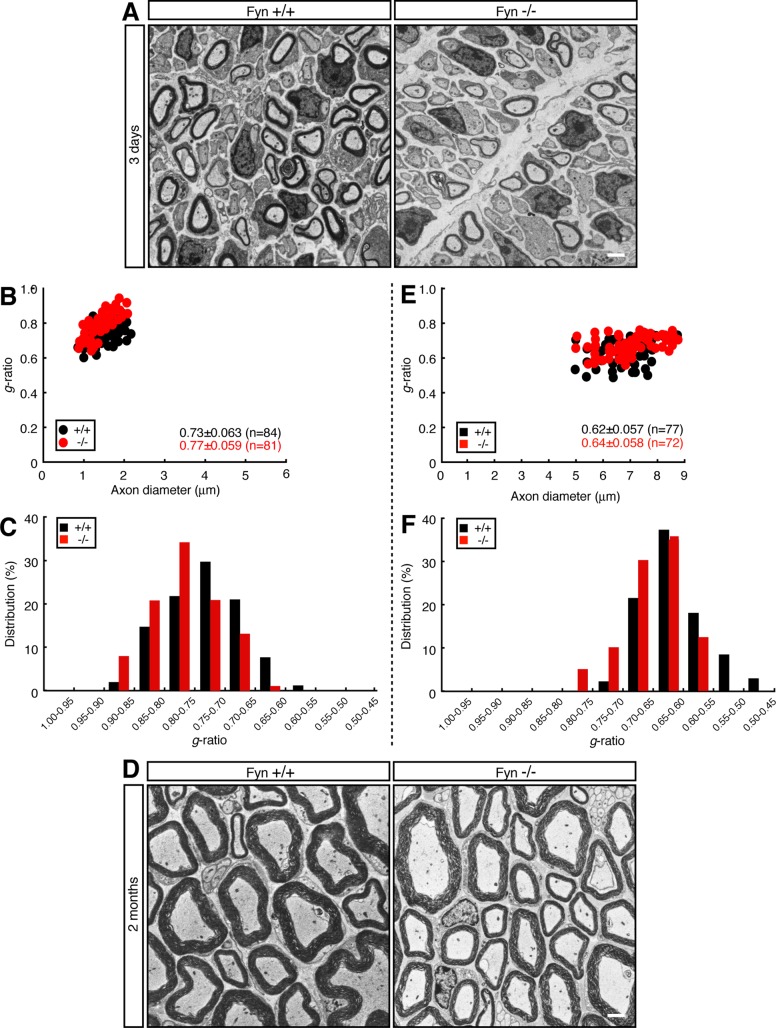
FIGURE 5:
Electron microscopic analyses of sciatic nerves of Fyn-knockout mouse. (A) Electron microscopic photographs of 3-d-old Fyn+/+ and Fyn−/− mouse sciatic nerves (n = 84 and 81, respectively). Scale bar, 1 μm. (B) The g ratio vs. axon diameter. The average g ratio is also given. (C) The relative distributions of the g ratio. (D) Electron microscopic photographs of 2-mo-old Fyn+/+ and Fyn−/− mouse sciatic nerves (n = 77 and 72, respectively). Scale bar, 1 μm. (E) The g ratio vs. axon diameter for these mice. The average g ratio is also given. (F) The relative distribution of the g ratio for these mice.

