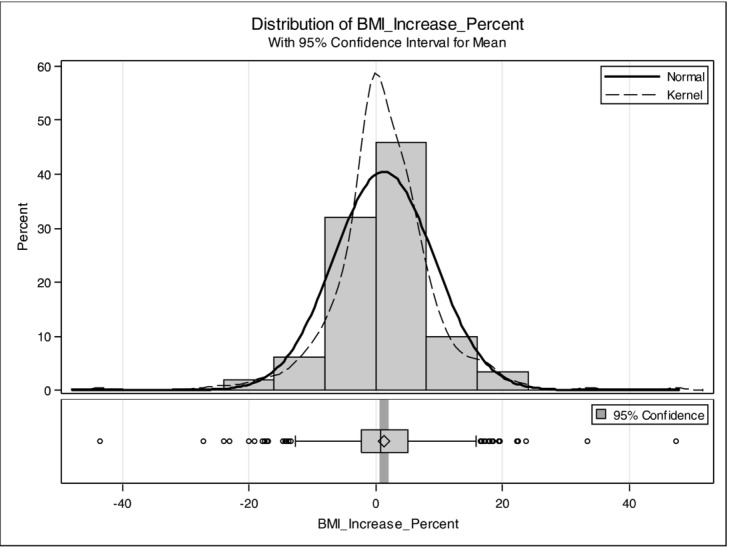
Figure 1.

The percentage change in BMI was compared with the percentage of patient distribution. Changes in BMI are plotted as a percentage change. The mean change in BMI was 1.4% with a normal distribution and a range of −43.5% to 47.4%. BMI indicates body mass index.
