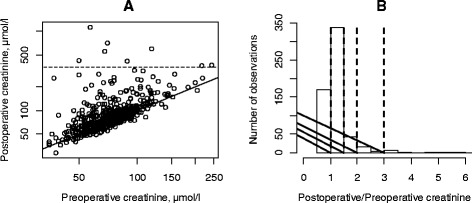
Fig. 1.

a XY plot of preoperative versus postoperative serum creatinine. The patients had a mean increase in postoperative serum creatinine of 8 μmol/l (0.0–15.4, 95 % confidence interval on the difference, P = 0.05 paired t-test). The diagonal line depicts no change. The broken line is set at the limit of 355 μmol/l (see Table 2). The normal range for women is 50–90 μmol/l and for men 60–105 μmol/l. b Histogram of relative change in serum creatinine. The mean relative change was 1.2. The vertical broken lines depict 1 = no change, 1.5, 2, and 3 according to the RIFLE classification
