
Figure 2.
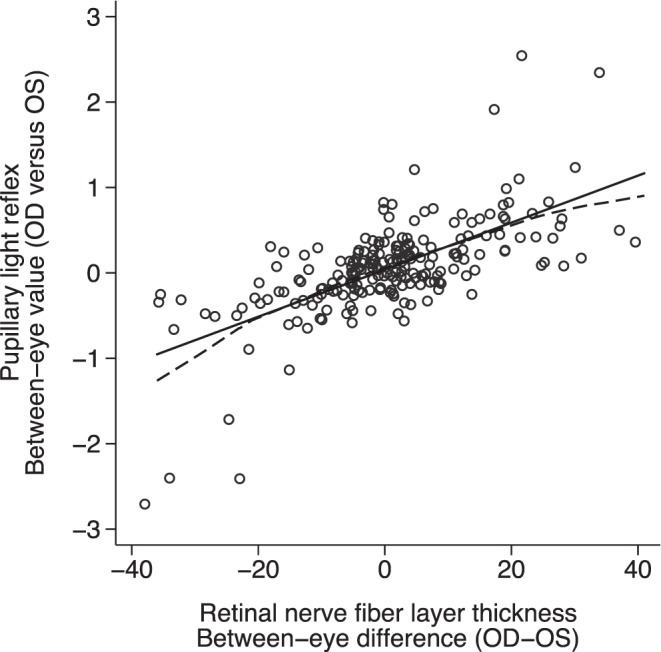
The relationship of between-eye asymmetry in PLR and RNFL thickness (P < 0.001, R = 0.67, R2 = 0.44). The solid line is the linear least squares regression and the dashed line is the locally weighted smoothed line.
Official websites use .gov
A
.gov website belongs to an official
government organization in the United States.
Secure .gov websites use HTTPS
A lock (
) or https:// means you've safely
connected to the .gov website. Share sensitive
information only on official, secure websites.
The relationship of between-eye asymmetry in PLR and RNFL thickness (P < 0.001, R = 0.67, R2 = 0.44). The solid line is the linear least squares regression and the dashed line is the locally weighted smoothed line.