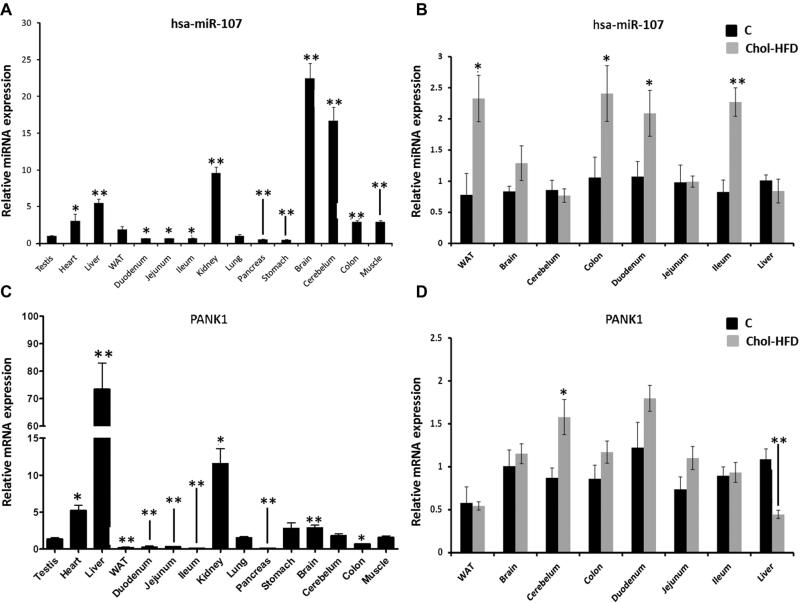
Figure 3.
Analyses of miRNA-107 and PANK1 levels in mice tissues and in response to a Chol-HFD. miRNA-enriched RNA was extracted from tissues of 8-weeks old mice fed a chow or a Chol-HFD diet (n=5 per group) for 16 weeks and levels of miRNA-107 and PANK1 were measured by RT-qPCR. (A) RT-qPCR of miRNA-107 in tissues of control mice. (B) Comparison of miRNA-107 levels in tissues of mice fed a chow (black bars) or a Chol-HFD (grey bars). (C) RT-qPCR of PANK in tissues of control mice. (D) Comparison of PANK1 levels in tissues of mice fed a chow (black bars) or a Chol-HFD (grey bars). Data are the mean of 5 samples per tissue and group and two technical replicates ± SEM. * p<0.05; ** p<0.001.

