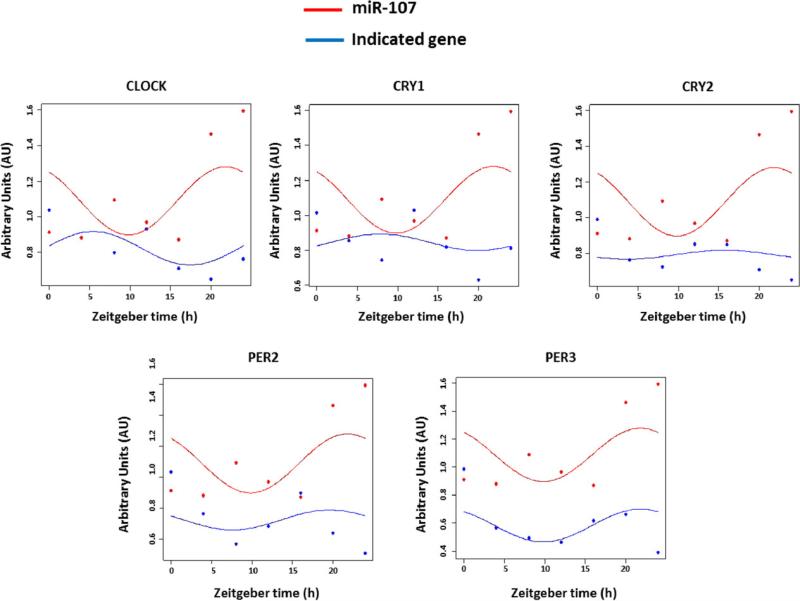
Figure 7.
Circadian oscillation of miR-107 and the core CLOCK genes. Caco-2 cells were synchronized by a serum shock. Then, samples were harvested every 4 hours from a period of 24 hours. The expression levels of miR-107 and the core-CLOCK genes were analysed by RT-PCR. Data are represented as Arbitrary Units (AU) in every zeitgeber time. The represented graphs correspond to a representative experiment of a total of three, each one performed in triplicate.

