
Figure 3.
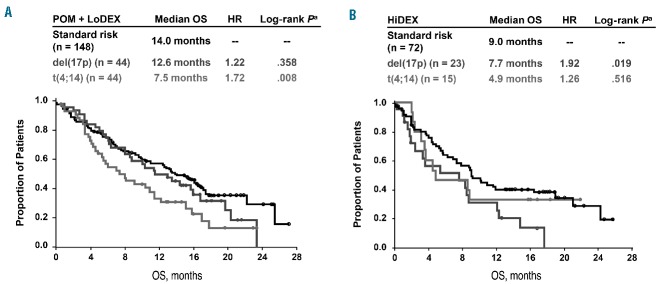
Kaplan-Meier curves of overall survival (OS) by cytogenetic risk groups for patients treated with (A) POM + LoDEX and (B) HiDEX. aLog-rank P vs. standard risk. HiDEX: high-dose dexamethasone; HR: hazard ratio; LoDEX: low-dose dexamethasone; POM: pomalidomide.