
FIGURE 2.
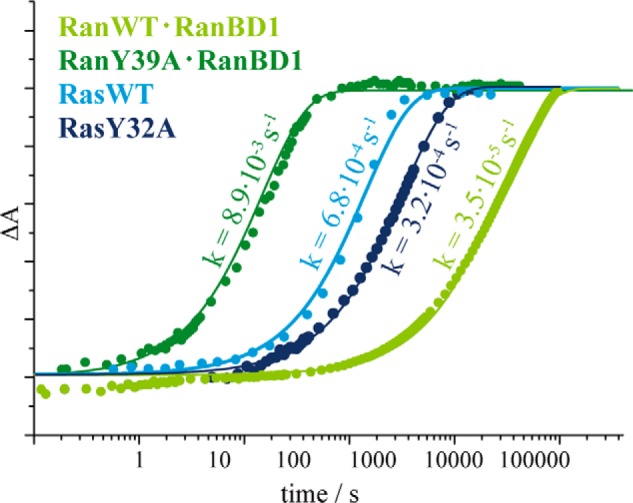
Comparison of the kinetics of Ran·RanBD1, RanY39A·RanBD1, Ras, and RasY32A. The normalized absorbance differences of adjacent bands of the GTP and GDP state are shown as a measure for the progress of the hydrolysis. The fits to single exponential functions are shown as continuous lines.