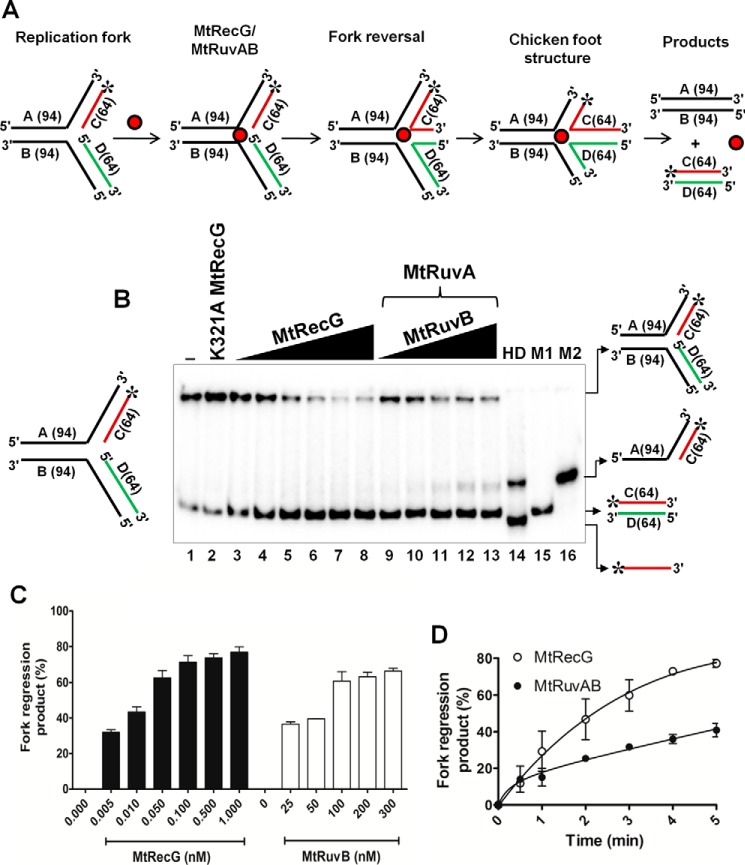
FIGURE 3.
RFR activity of M. tuberculosis RecG and RuvAB proteins. A, schematic representation of oligonucleotide-based replication fork reversal and outcome of the fork reversal reaction. The asterisk indicates the 32P label. Oligonucleotides are indicated by letters, and the length of each oligo is shown in parentheses. B, analysis of RFR in the presence of increasing concentrations of MtRecG and MtRuvAB. Reaction mixture contained 10 nm 32P-labeled substrates, 1 mm ATP, and 5 mm MgCl2. Reactions were initiated by addition of 0.005, 0.01, 0.05, 0.1, 0.5, and 1.0 nm MtRecG (lanes 3–8, respectively) and 50 nm MtRuvA with 25, 50, 100, 200, and 300 nm MtRuvB (lanes 9–13, respectively). Lane 1, reaction mixture in the absence of any protein; lane 2, 10 nm K321A MtRecG; lane 14 shows heat-denatured substrate, and lanes 15 (M1) and lane 16 (M2) represents markers. Reaction products were resolved on 8% native polyacrylamide gel and analyzed by autoradiography. C, quantitative data for the ability of MtRecG- and MtRuvAB-mediated RFR. D, kinetics of fork reversal catalyzed by MtRecG and MtRuvAB proteins. The reactions were initiated by addition of 0.1 nm MtRecG and 100/300 nm MtRuvA/RuvB, respectively, in a reaction buffer containing 10 nm substrates with 1 mm ATP and 5 mm MgCl2. Reactions were terminated at indicated time intervals, and products were resolved on 8% native polyacrylamide gel and visualized by autoradiography. The error bars represent standard error of the mean (S.E.) from three independent experiments.

