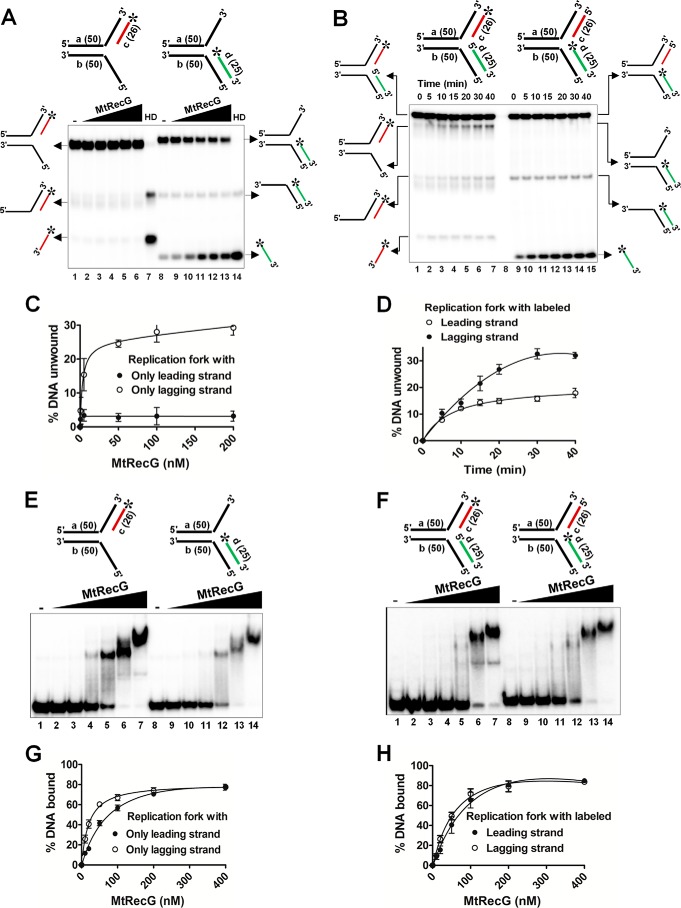
FIGURE 5.
M. tuberculosis RecG prefers replication fork substrates containing lagging strand at the fork junction. A, reactions contained 1 nm 32P-labeled substrate (shown on top of each panel) in the absence (lanes 1 and 8) or presence of 0.5, 5, 50, 100, and 200 nm MtRecG (lanes 2–6 and lanes 9–13, respectively). Reactions were terminated and resolved on 8% native polyacrylamide gel and visualized by autoradiography. Lanes 7 and 14 show heat-denatured substrates. B, rates of unwinding of replication fork with indicated time points (shown on top) with 100 nm MtRecG. C and D, quantitative data for the experiments shown in A and B, respectively. Electrophoretic mobility shift assay showing binding affinity of MtRecG to partial (E) or complete (F) replication fork structures. Reactions contained 0.5 nm 32P-labeled substrate (shown on top of each panel) in the absence (lanes 1and 8) or presence of 10, 20, 50, 100, 200, and 400 nm MtRecG (lanes 2–7 and lanes 9–14, respectively). G and H, graphical representation of the amount of DNA substrate bound by MtRecG for experiments shown in E and F, respectively.

