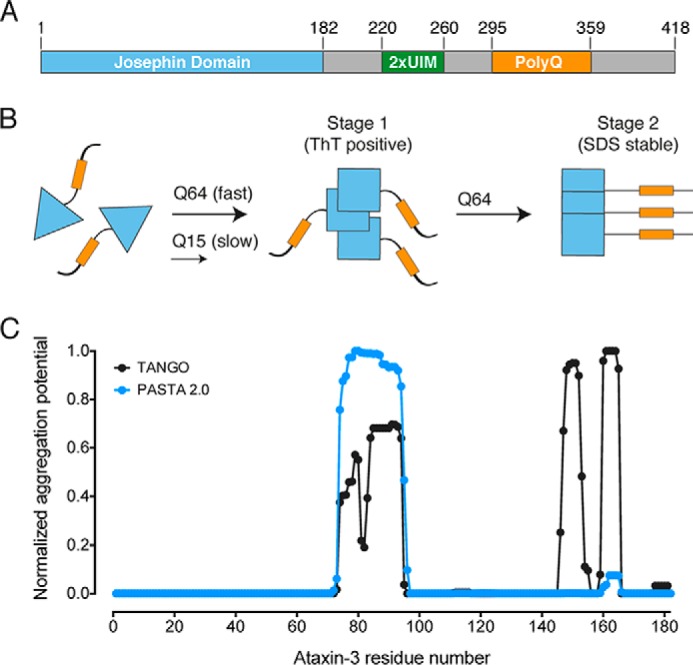
FIGURE 1.

The ataxin-3 aggregation pathway. A, ataxin-3 domain layout with domains and the polyQ tract indicated. 2xUIM, two ubiquitin-interacting motifs. B, schematic representation of the two-stage aggregation pathway of ataxin-3. Pathologically expanded ataxin-3 aggregates at a faster rate than non-expanded ataxin-3. Conformational changes within the Josephin domain (blue triangles) define the first-stage of aggregation. Only expanded ataxin-3 progresses to a second stage, defined by the formation of SDS-stable aggregates (yellow rectangles indicate poly(Q) tract). C, computational prediction of amyloidogenic regions of the ataxin-3 Josephin domain.
