FIGURE 5.
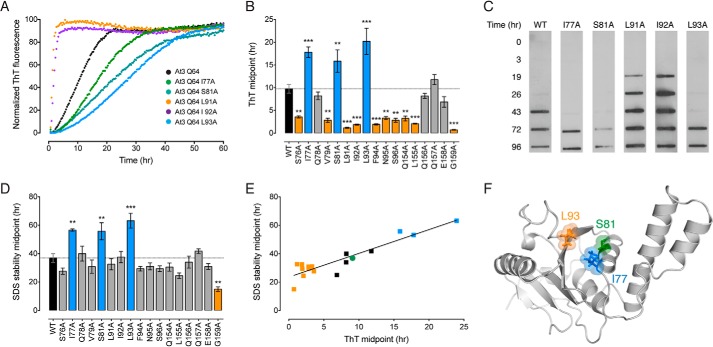
Alanine-scanning mutagenesis of the ataxin-3(Q64) catalytic domain. A, representative ThT kinetic traces of the first aggregation stage of wild-type ataxin-3(Q64) or indicated alanine-scanning mutants. B, midpoints of the first aggregation stage of ataxin-3(Q64) alanine-scanning mutants. Mutants that aggregated significantly slower than wild-type protein are in blue, mutants that aggregated faster are in orange, and mutants that showed no change are in gray. C, the second aggregation stage was monitored by measuring SDS insolubility with a membrane filter trap assay. Representative blots of wild-type ataxin-3(Q64) or indicated alanine-scanning mutants are shown. D, midpoints of the second aggregation stage of ataxin-3(Q64) alanine-scanning mutants colored as per B. E, linear relationship between the two stages of ataxin-3(Q64) aggregation in the alanine-scanning mutants. Control ataxin-3(Q64) is represented as a green circle, mutants that aggregate slower in blue, and mutants that aggregate faster are in orange. F, location of the alanine mutations in the structure of the Josephin domain (PDB code 1YZB (22)). Error bars indicate means ± S.E. **, p < 0.01 and ***, p < 0.001 versus wild-type, one-way analysis of variance with Dunnett's multiple comparison test (n = 3–5).

