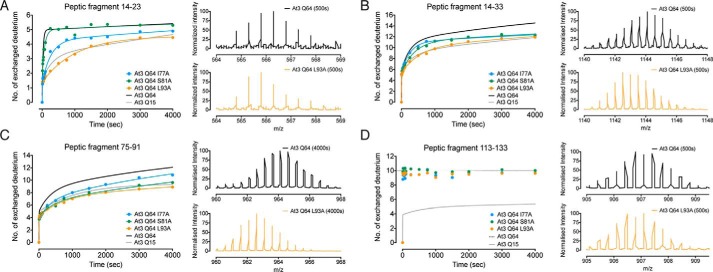
FIGURE 7.
Localized structural perturbations link polyQ expansion to aggregation. A–D, HDX-MS kinetics of ataxin-3(Q64) I77A, S81A, and L93A with peptic fragments 14–23 (A), 14–33 (B), 75–91 (C), and 113–133 (D) represented in comparison with wild-type ataxin-3(Q64) (black) and ataxin-3(Q15) (gray). For each peptic fragment, representative m/z spectra of wild-type ataxin-3(Q64) and ataxin-3(Q64) L93A are shown for comparison.

