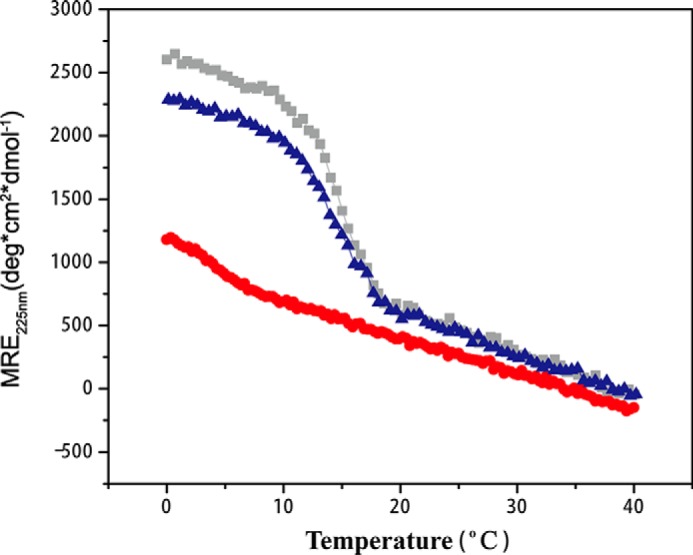
FIGURE 2.

CD thermal transitions of peptide A (gray) and B (red) and a mixture with molar ratio of 2A:1B (blue). CD measurements were recorded at a concentration of 0.28 mm, whereas the NMR experiments were carried out at a higher concentration of 6 mm.
