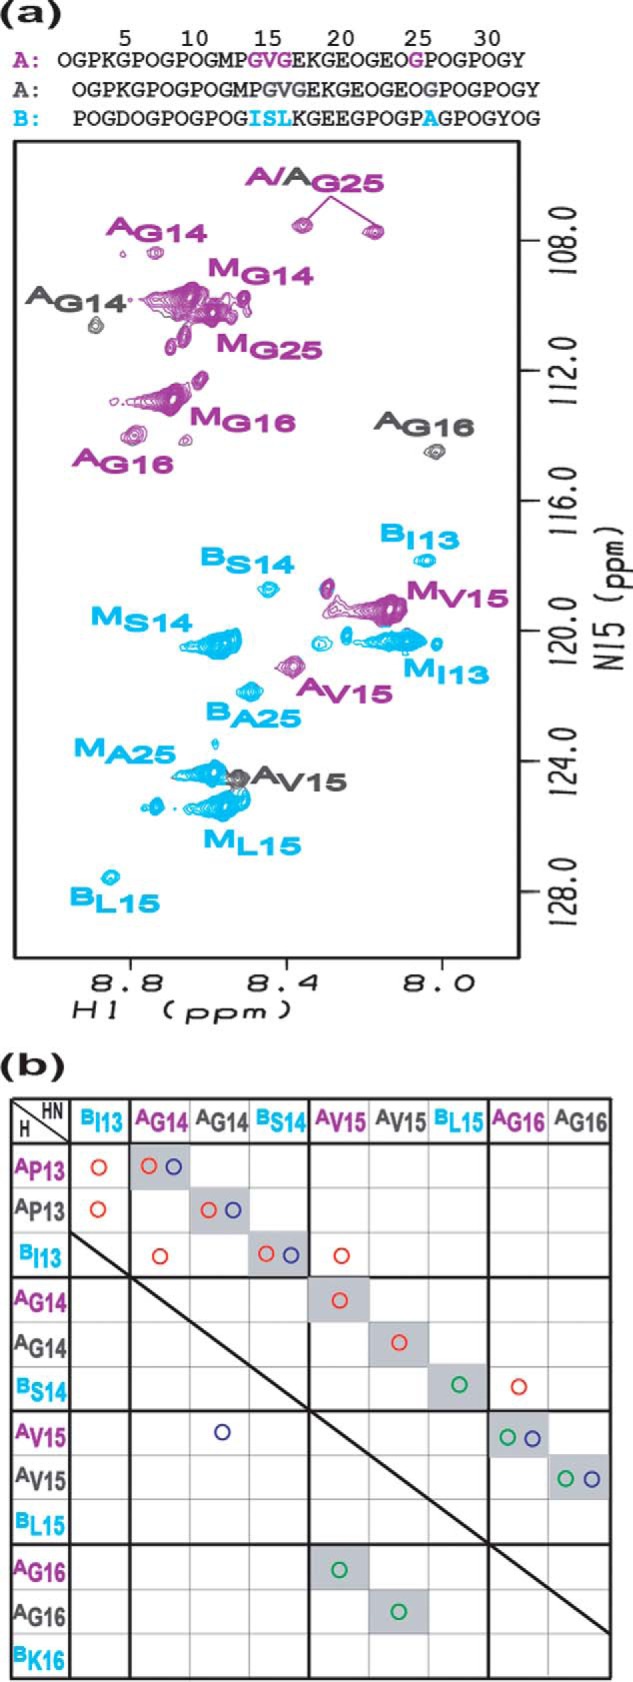
FIGURE 4.

a, 1H-15N HSQC spectrum of peptide mixture 2A:1B. Violet and gray colors are used to distinguish two different A chains in the heterotrimer, and chain B is colored in azure. Labeled residues are colored violet, gray, and azure in the first A chain, the second A chain, and chain B, respectively. The peaks corresponding to the trimer states are denoted with a superscript A or B, respectively, whereas those for the monomer state are denoted with a superscript M. b, contact map generated from NH-H experimental NOEs of peptide mixture 2A:1B. Experimental NOEs are represented by circles: HN-HN (green circle); HN-HA (red circle); and HN-side chain protons (blue circle). The shaded squares in the background denote intrachain NOEs.
