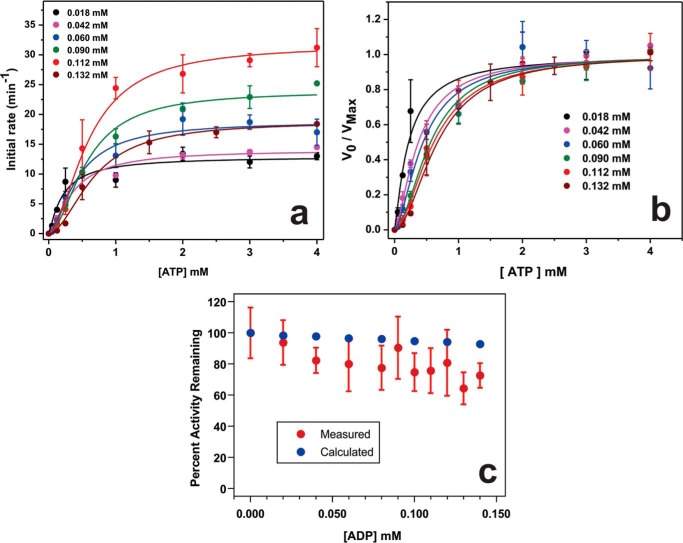
FIGURE 2.
Effect of ADP on Rca turnover. a, ADP ranging in concentration from 18 to 132 μm was added to tobacco Rca preparations prior to initial rate measurements as a function of ATP concentration. Curve fits to Equation 2 are shown. The inhibition constant Ki for ADP was fitted globally, whereas kcat and nH were fitted individually for each data set (Table 3). The Km value was fixed to 104 μm (Table 1). (Each data set was also fitted individually to Equation 1, see Table 2.) b, data from a replotted upon normalization with respect to kcat values. c, initial turnover velocities measured as a function of ADP concentration and normalized with respect to 0 ADP. Experiments were carried out at 2 mm ATP and 5 mm free magnesium ion concentration and utilizing three different protein preparations. At each ADP concentration, the average percent rate and its standard deviation were calculated for 3–6 individual rate determinations (red data points). For each ADP concentration, the expected percent activity remaining was calculated from the kinetic constants shown in Table 3 (blue data points).

