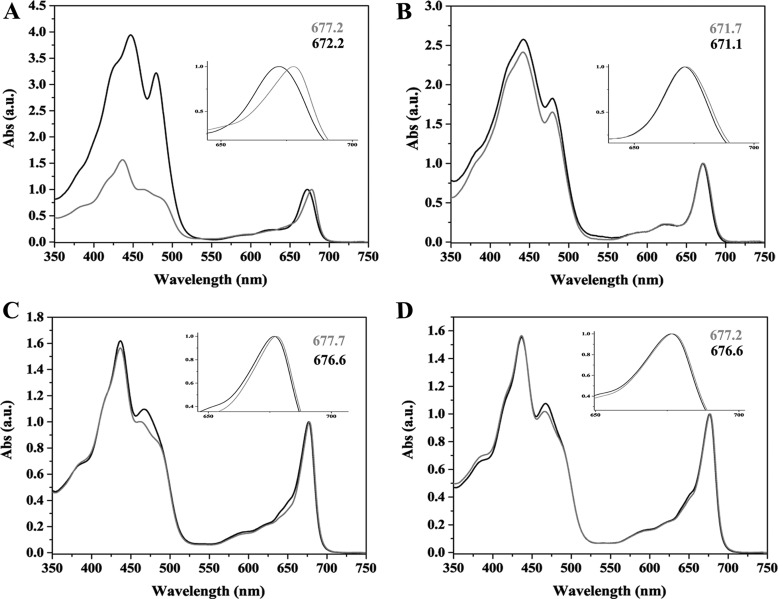
FIGURE 3.
Absorption (Abs) spectra of fractions obtained from sucrose gradient. Spectra of B1 fraction from WT (black line) versus oeLHCSR1 (gray line) of N. benthamiana (A) and N. tabacum (B) are shown. Absorption spectra of B2 fraction from WT (black line) and oeLHCSR1 (gray line) of N. benthamiana (C) and N. tabacum (D) are shown. Peak wavelengths are indicated. a.u., arbitrary units.

