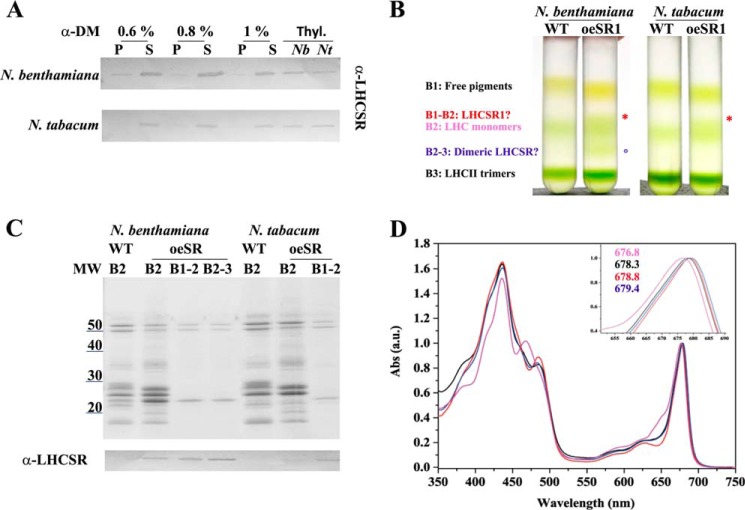
FIGURE 8.
Untagged PpLHCSR1 isolation and biochemical characterization. A, immunoblot of fractions obtained by solubilizing thylakoids by different concentration of α-DM probed with α-PpLHCSR antibody. An equal amount of Chl (0.25 μg) was loaded for each fraction. Thylakoids of oeLHCSR1 of N. benthamiana and N. tabacum are shown as reference. Thyl, thylakoids; Nb, N. benthamiana; Nt, N. tabacum. B, sucrose gradient of supernatant obtained by solubilizing thylakoids from WT and oeLHCSR1 (oeSR1) of both plant systems with 0.8% α-DM. C, polypeptide composition of fractions harvested from the sucrose gradient of oeLHCSR1 plants. 0.5 μg of Chl was loaded for B2, and 0.3 μg of Chl was loaded for other green bands. In the lower panel, the immunoblot with α-PpLHCSR antibody is shown. D, absorption (Abs) spectra of monomeric LHCs (pink line) and B1–2 (black line) from the sucrose gradient of N. tabacum and from B1–2 (red line) and B2–3 (blue line) from the sucrose gradient of N. benthamiana. a.u., arbitrary units.

