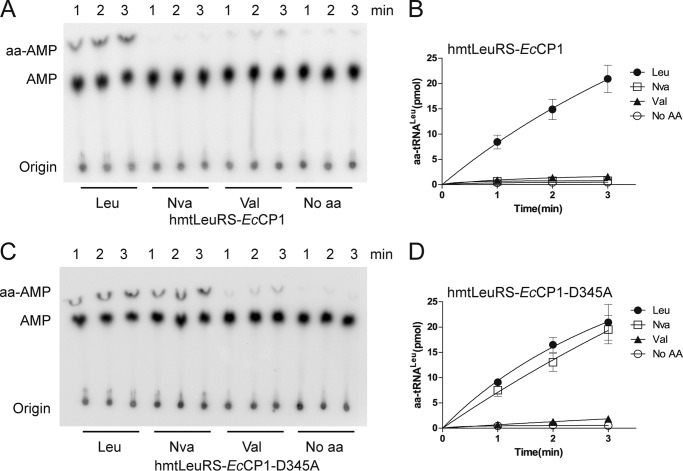
FIGURE 9.
Restoration of translational fidelity of hmtLeuRS. A, graphical representations showing aminoacylation assays using 600 nm hmtLeuRS-EcCP1. The concentrations of Leu, Nva, and Val used here were 20, 20, and 100 mm, respectively. B, quantification of aminoacylated tRNA at various time points by hmtLeuRS-EcCP1 for Leu, Nva, and Val. C, graphical representations showing aminoacylation assays by 600 nm hmtLeuRS-EcCP1-D345A. The concentrations of Leu, Nva, and Val used here were 20, 20, and 100 mm, respectively. D, quantification of aminoacylated tRNA at various time points using hmtLeuRS-EcCP1-D345A for Leu, Nva, and Val.

