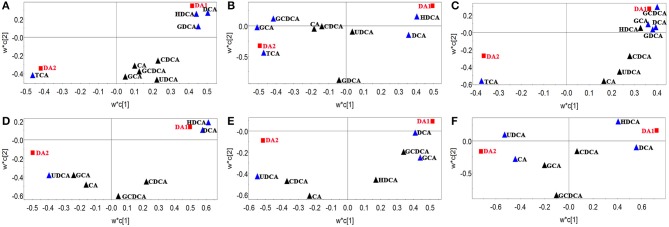
Figure 4.

Loading plots of PLS-DA between normal control group and raw HSW overdose treatment group, processed HSW overdose treatment group, chlorpromazine treatment group, respectively. Loading plots of PLS-DA between normal control group and raw HSW overdose treatment group based on bile acids in rat bile (A) and rat serum (D). Loading plots of PLS-DA between normal control group and processed HSW overdose treatment group based on bile acids in rat bile (B) and rat serum (E). Loading plots of PLS-DA between normal control group and chlorpromazine treatment group based on bile acids in rat bile (C) and rat serum (F). Blue triangles were BAs with VIP > 1 in the model.
