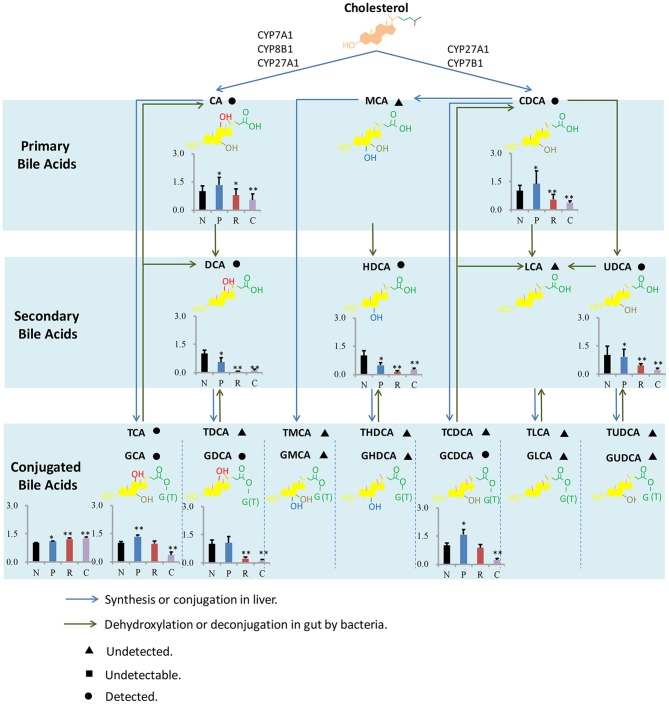
Figure 5.
Bile acids metabolism in liver and intestine. The bar graphs show the differences of concentrations of BAs between four groups, and the concentrations of BAs in normal control group were set as 1 as the control. N, P, R, and C represent the normal control, processed HSW, raw HSW and chlorpromazine group separately. **P ≤ 0.01; *P ≤ 0.05, significantly change was observed when compared with normal control.

